The AI Usage Dashboard in HighLevel gives Agency Admins a centralized place to monitor AI activity, usage, and billing across their agency. From AI Suite, admins can review transaction totals, wallet charges, token consumption, usage trends, billing coverage, product-level activity, and individual AI transactions. Filters and reporting controls make it easier to move from an agency-wide overview to the specific location, reporting period, product, or transaction that needs attention.
Note: The AI Usage Dashboard is available at the Agency level for Agency Admins. Agency Admins can review activity across all locations or narrow the dashboard to an individual sub-account.
TABLE OF CONTENTS
- What is the AI Usage Dashboard?
- Key Benefits of AI Usage Dashboard
- Filter AI Usage by Location and Date Range
- Summary Cards
- Expanded Usage Details
- Usage Over Time
- Transactions Table
- Transaction Details
- Supported AI Products
- How To Setup AI Usage Dashboard
- Frequently Asked Questions
- Related Articles
What is the AI Usage Dashboard?
The AI Usage Dashboard is the reporting area within AI Suite for understanding how AI products are being used and billed across an agency. It combines high-level usage totals, trend reporting, billing details, product activity, and individual transaction records so Agency Admins can begin with an overall view and investigate specific activity when needed.
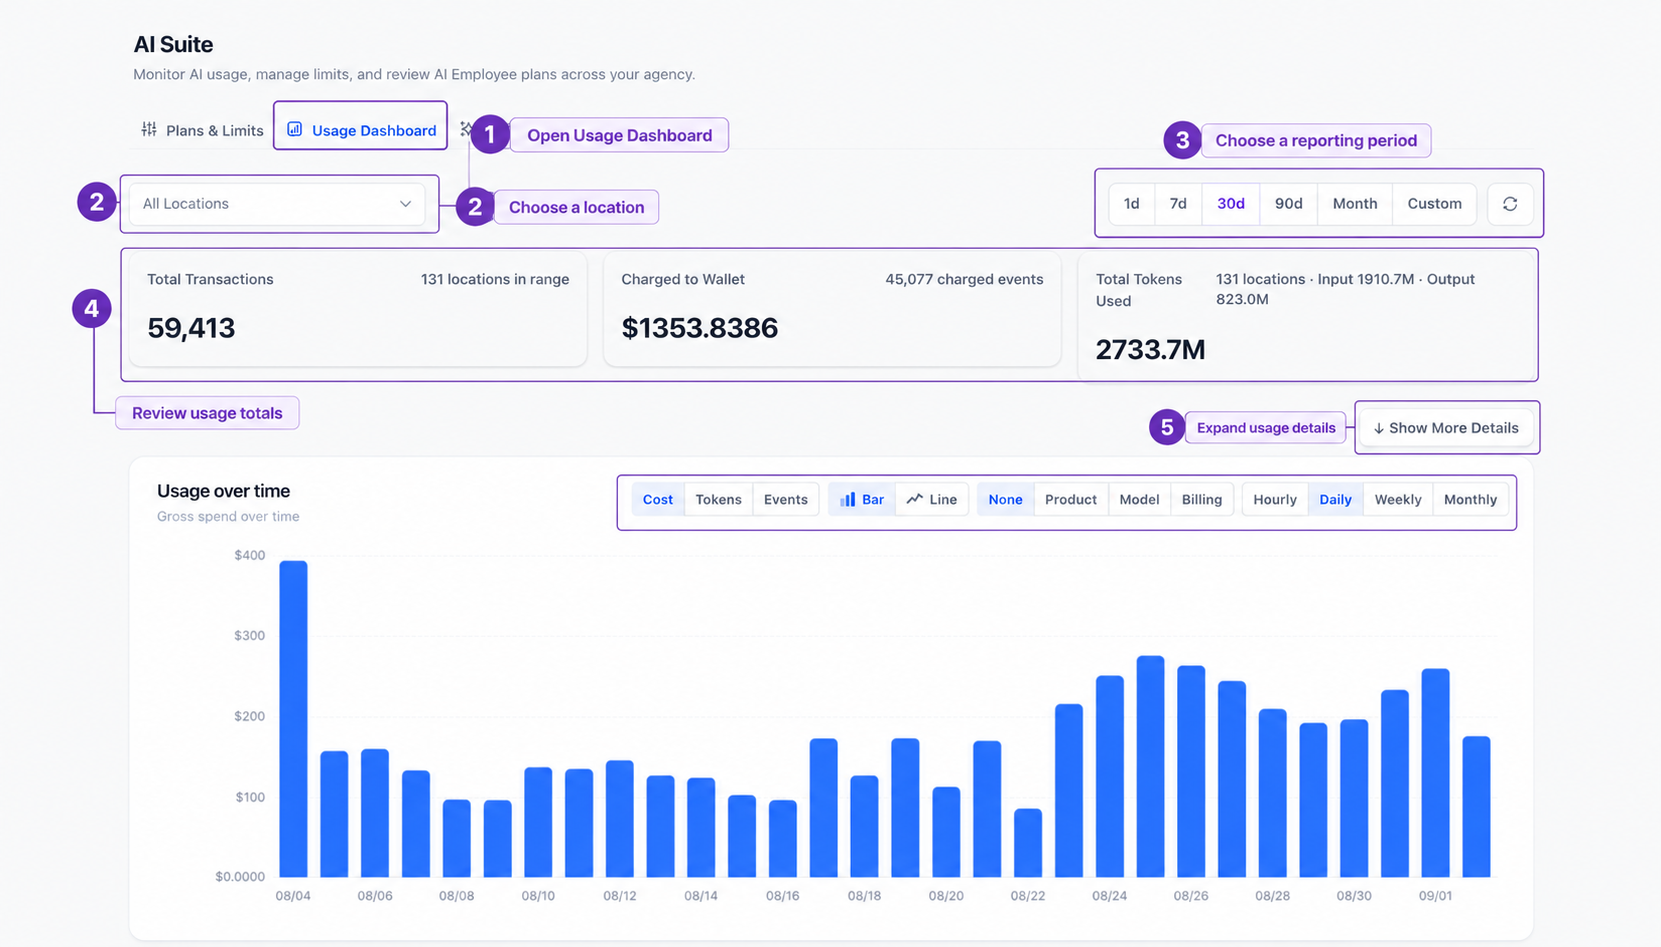
From Agency View, select AI Suite, then select the Usage Dashboard tab.
At the top of the dashboard, you can:
- Choose the location or sub-account you want to review.
- Choose the reporting period.
- Review Total Transactions, Charged to Wallet, and Total Tokens Used.
- Select Show More Details for additional billing and product information.
- Review the Usage over time chart.
Key Benefits of AI Usage Dashboard
Centralized AI reporting helps agencies understand both overall AI consumption and the individual events behind that activity. Agency Admins can use one dashboard to review usage trends, understand billing coverage, compare products, and investigate specific transactions without moving between multiple AI product areas.
- Centralized visibility: Review AI usage, transactions, tokens, and billing information from AI Suite.
- Agency-wide monitoring: Review all locations together or focus on one specific sub-account.
- Billing transparency: Understand how AI activity is divided between wallet charges, subscriptions, promotions, and free or zero-charge usage.
- Flexible trend analysis: Compare Cost, Tokens, and Events using different chart, grouping, and interval options.
- Product-level insights: Identify which AI products are generating activity within the selected reporting period.
- Transaction-level investigation: Open individual AI events to review billing, usage, processing components, and identifiers.
Filter AI Usage by Location and Date Range
Filtering the dashboard before investigating activity ensures that every summary card, chart, breakdown, and transaction reflects the business and reporting period you actually want to review. This is especially useful for agencies managing AI usage across multiple sub-accounts.
To filter the dashboard:
- Go to Agency View → AI Suite → Usage Dashboard.
- Select All Locations.
- Choose the sub-account you want to review, or leave All Locations selected for an agency-wide view.
- Choose 1d, 7d, 30d, 90d, Month, or Custom.
- If you select Custom, choose the start and end dates.
- Allow the dashboard to refresh with the selected data.
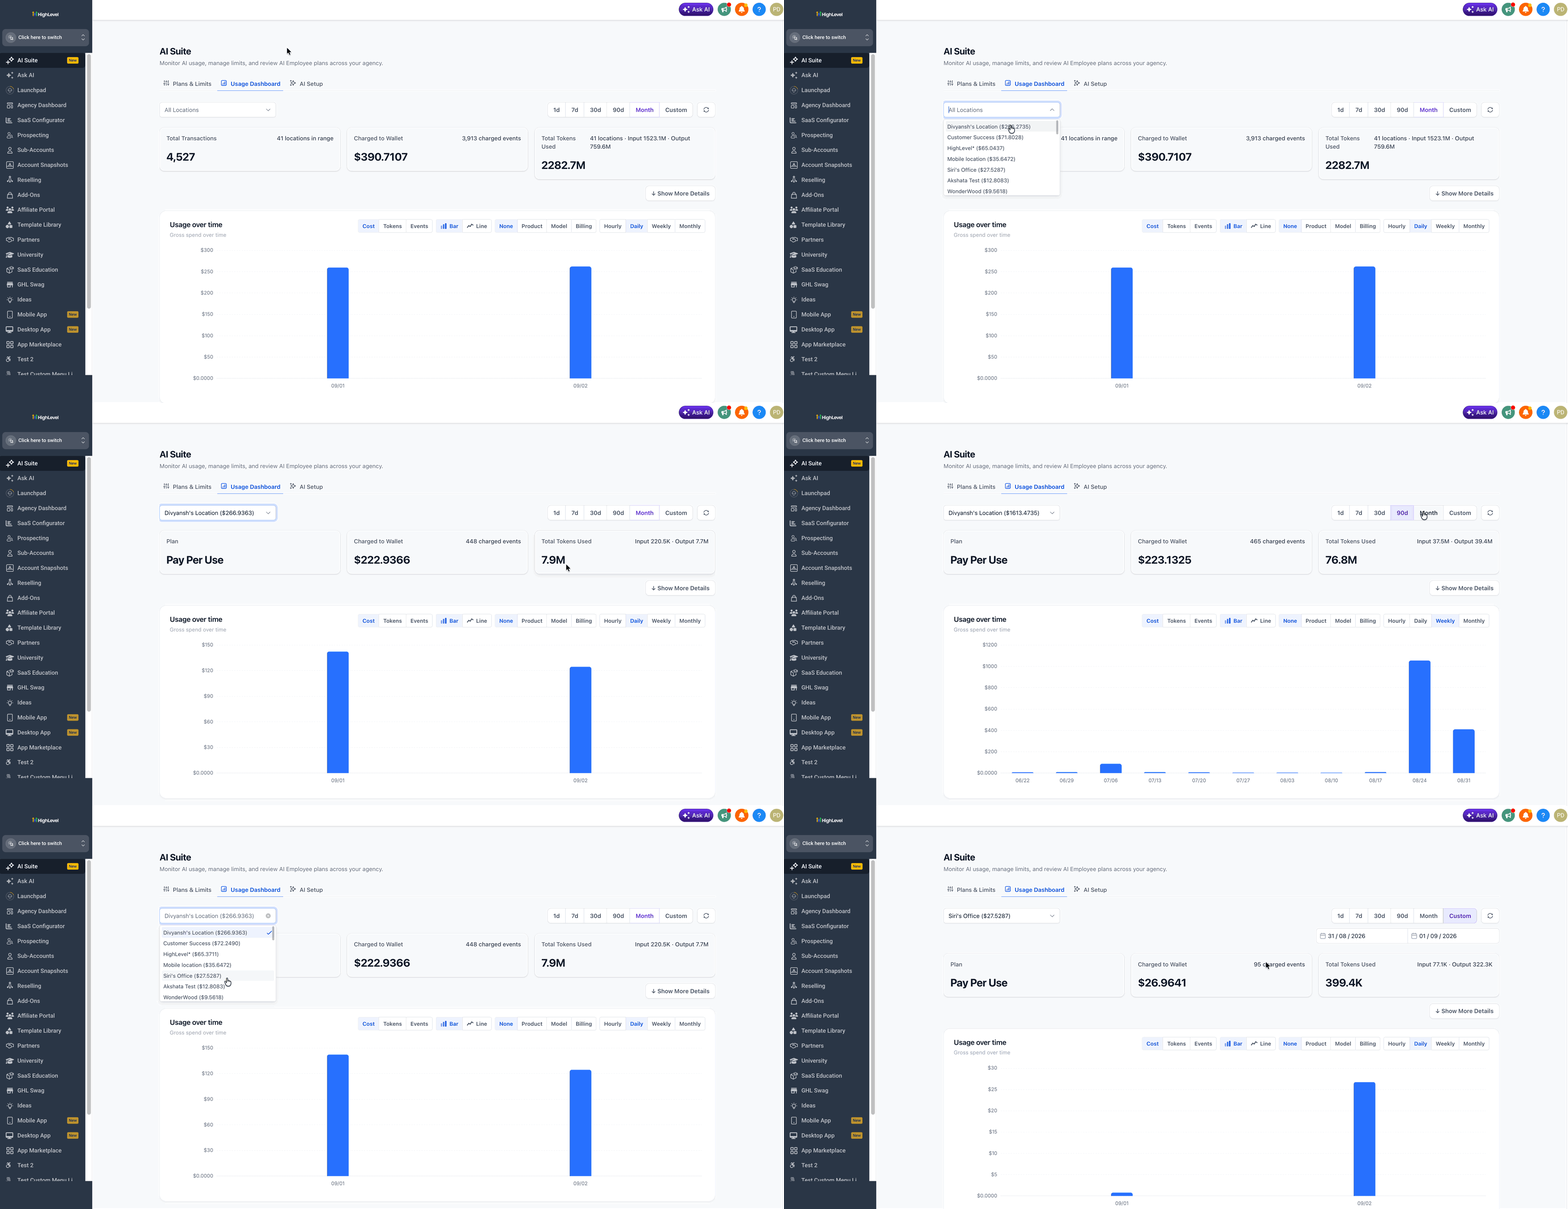
After the dashboard refreshes, the selected Location and reporting period apply across the summary cards, Usage over time chart, expanded details, and Transactions Table.
Summary Cards
The summary cards provide a quick snapshot of AI activity within the currently selected Location and reporting period. Reviewing these totals first gives Agency Admins a baseline before they investigate billing coverage, product usage, trends, or individual transactions.
- Total Transactions: Displays the number of AI transactions included in the selected reporting scope.
- Charged to Wallet: Displays the amount charged to the agency wallet and the number of charged events.
- Total Tokens Used: Displays total token consumption, including input and output tokens.
Changing the Location or date range updates these totals along with the rest of the dashboard.
Expanded Usage Details
Expanded Usage Details help explain how overall AI activity is being covered or charged and which products are contributing to usage. This is useful when the summary cards show activity that you want to investigate in greater detail.
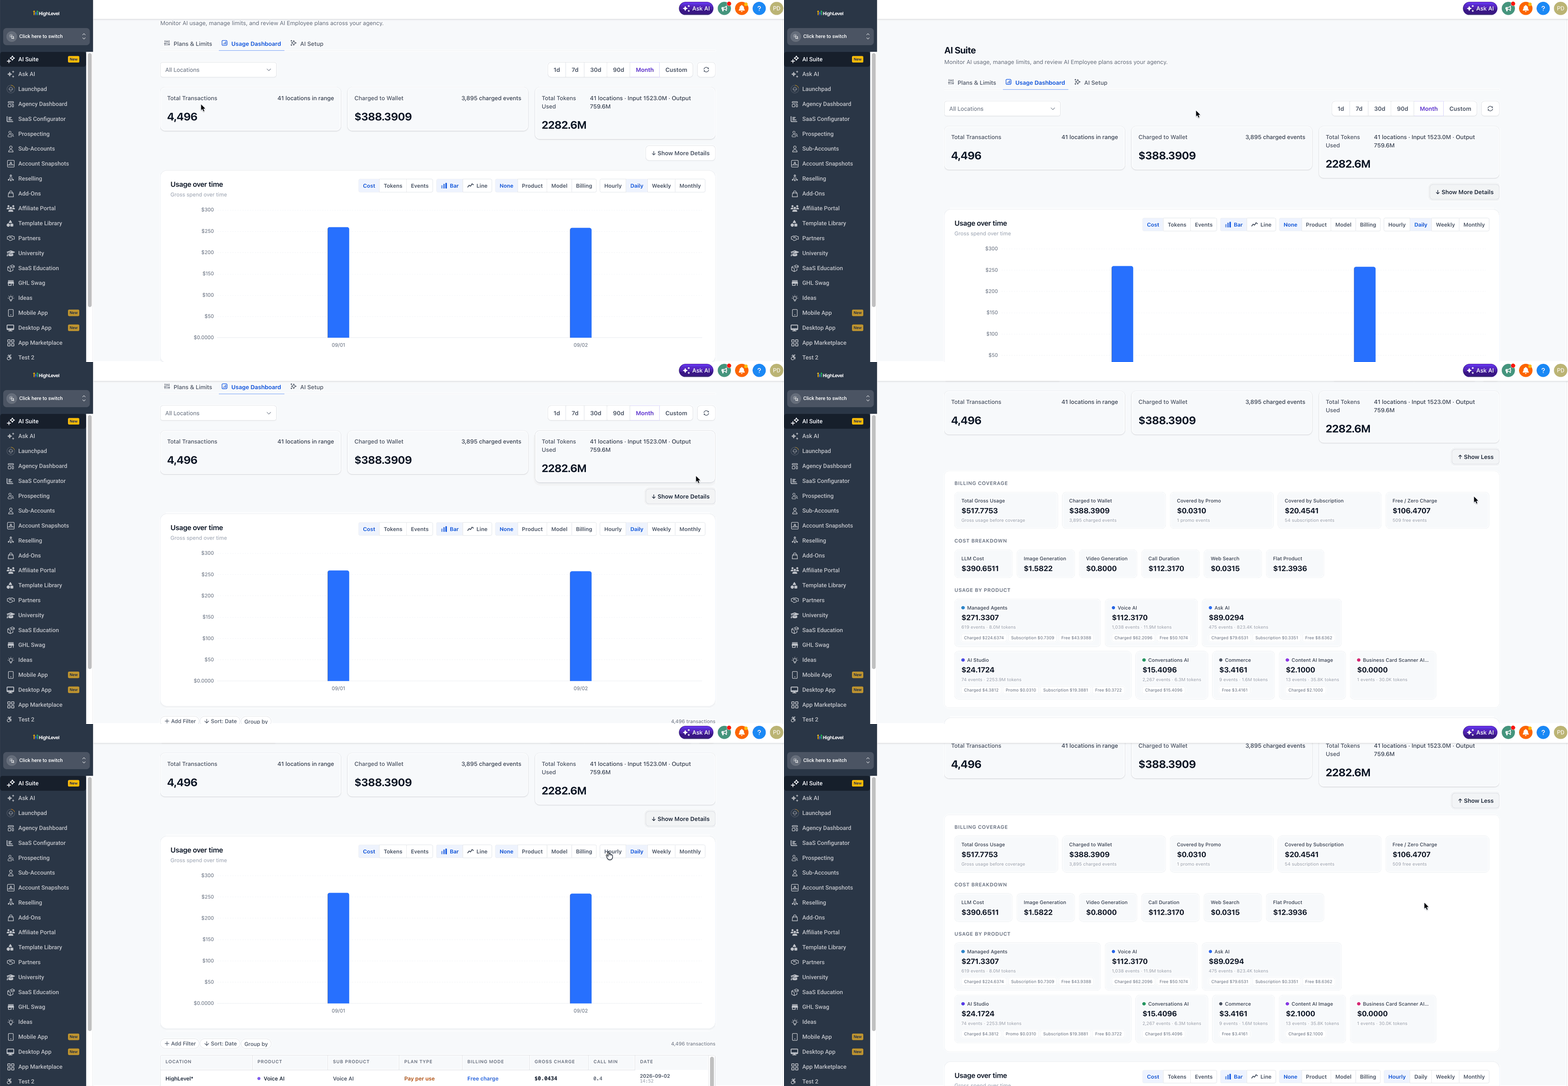
To open the expanded view:
- Confirm that the correct Location and reporting period are selected.
- Select Show More Details below the summary cards.
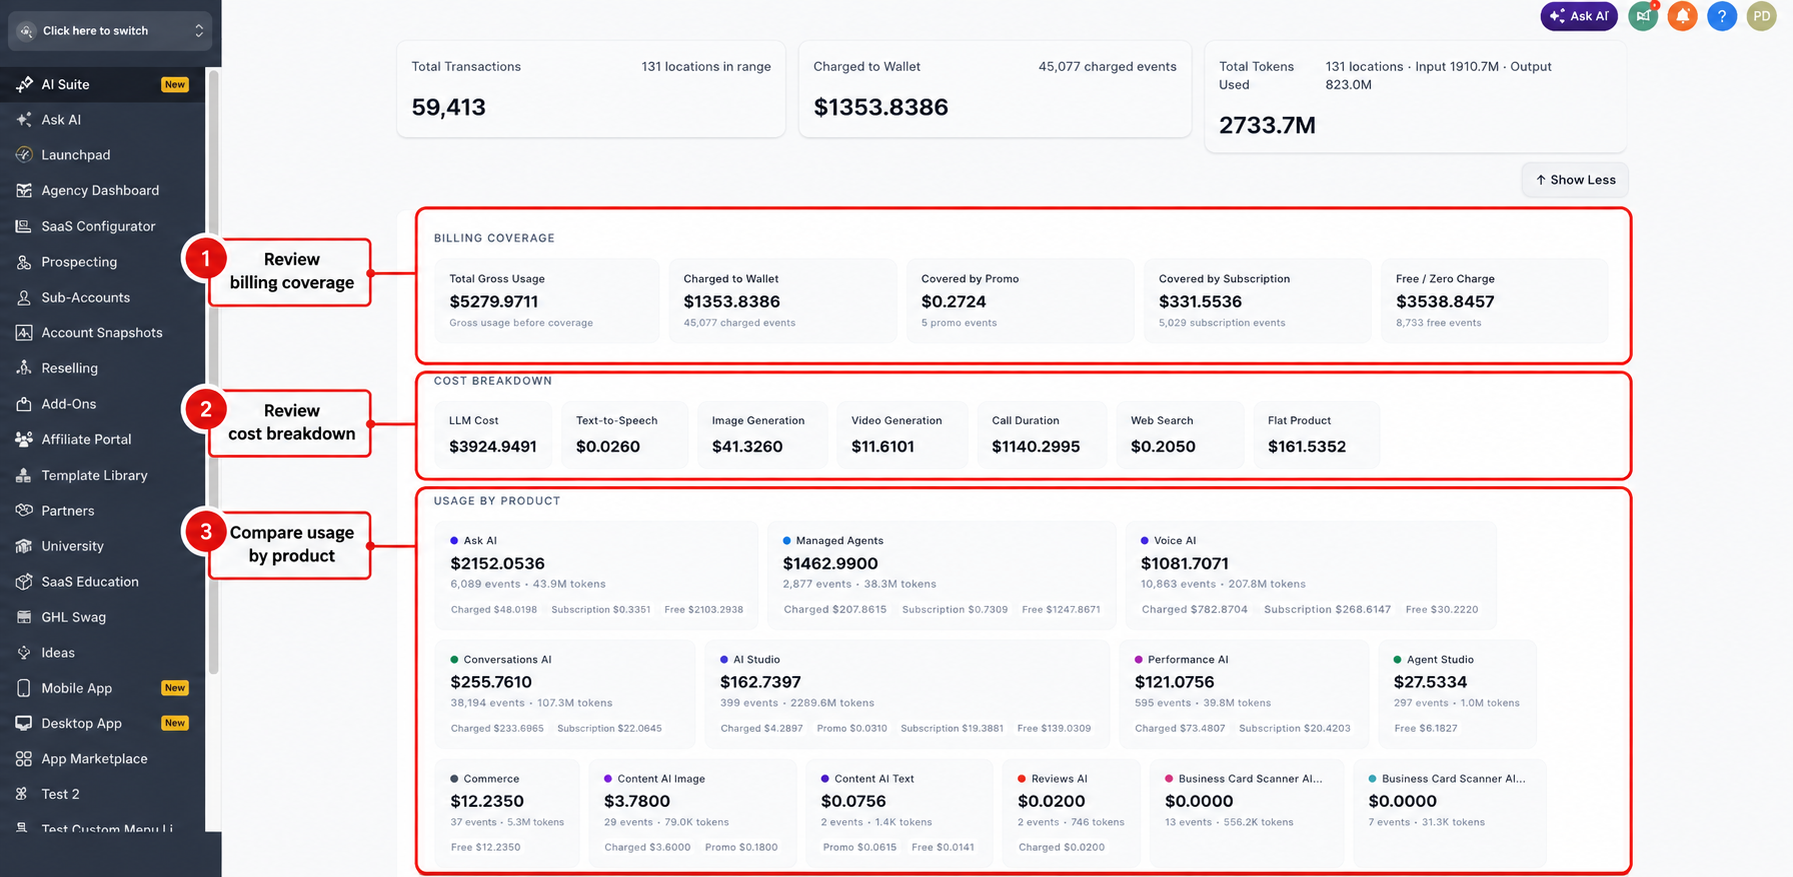
- Review the additional Billing Coverage, Cost Breakdown, and Usage by Product areas that appear.
Billing Coverage
Billing Coverage explains how gross AI usage is distributed across different coverage types. This helps Agency Admins understand why Total Gross Usage may be different from the amount actually charged to the wallet.
- Total Gross Usage
- Charged to Wallet
- Covered by Promo
- Covered by Subscription
- Free / Zero Charge
Cost Breakdown
Cost Breakdown separates AI usage according to the underlying services generating costs. This helps identify whether activity is primarily associated with language models, voice services, generated media, web searches, or other billable components.
- LLM Cost
- Text-to-Speech
- Image Generation
- Video Generation
- Call Duration
- Web Search
- Flat Product
Usage by Product
Usage by Product shows which AI products generated activity within the selected Location and reporting period. Product cards can include usage totals, event counts, token consumption, and applicable billing coverage.
Usage Over Time
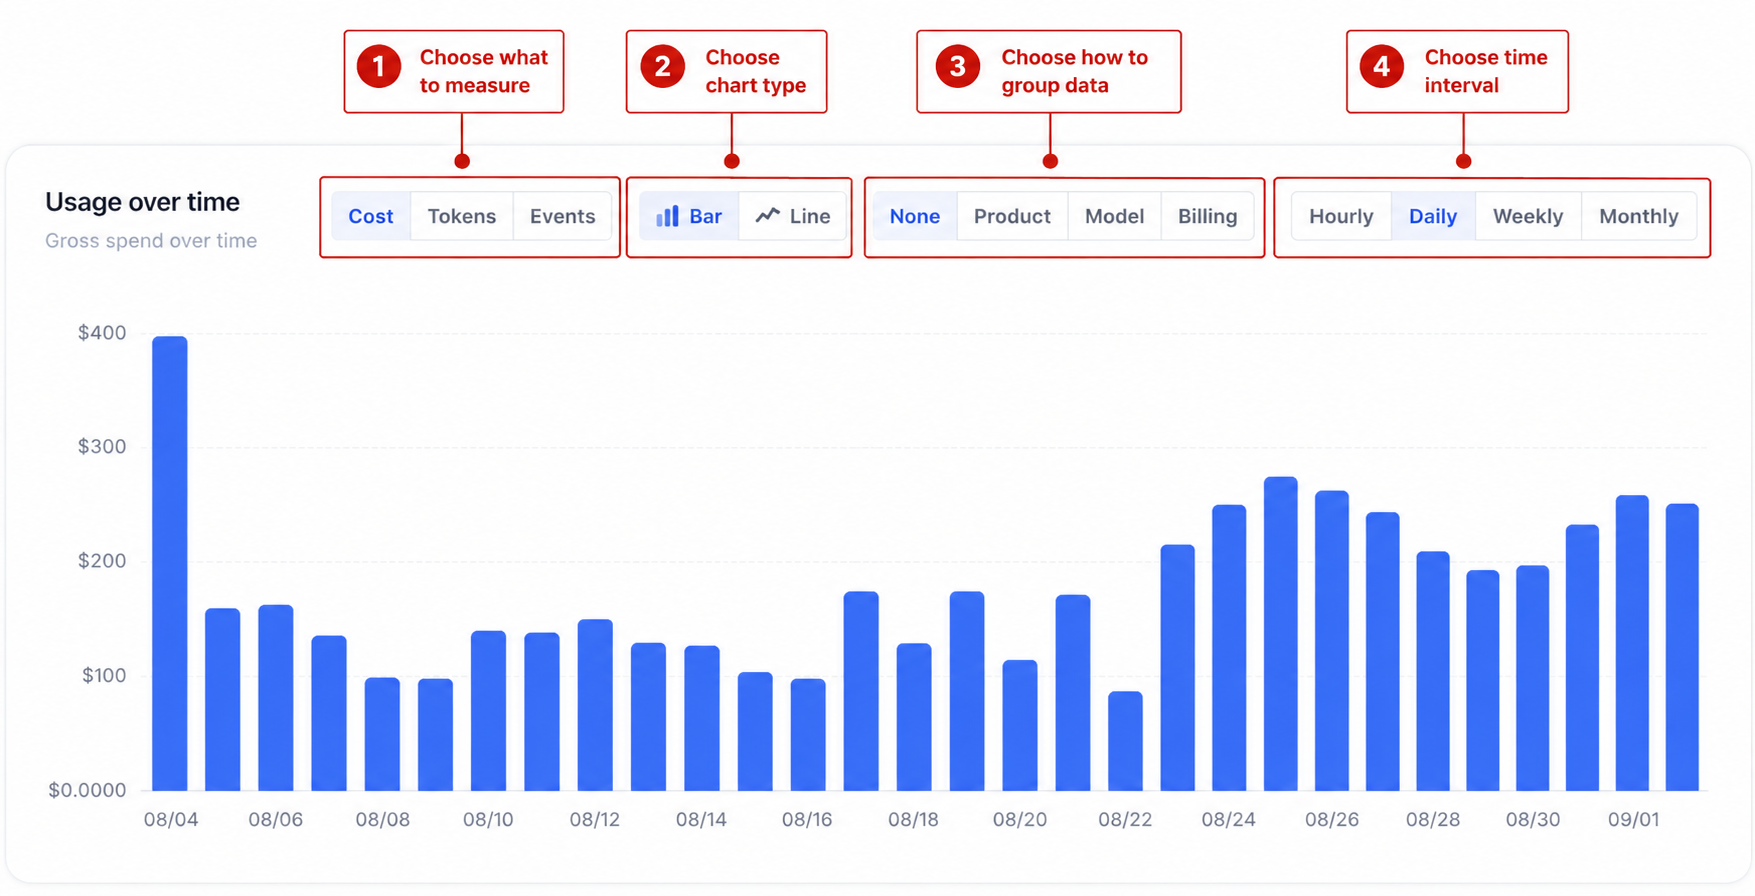
The Usage over time chart helps Agency Admins identify when AI activity occurred and how usage changes across the selected reporting period. The chart can be adjusted by metric, visualization type, grouping, and time interval so the same activity can be analyzed from different perspectives.
Configure the chart from left to right:
- Choose what to measure: Select Cost, Tokens, or Events.
- Choose the chart type: Select Bar or Line.
- Choose how the data is grouped: Select None, Product, Model, or Billing.
- Choose the time interval: Select Hourly, Daily, Weekly, or Monthly.
For example, selecting Cost → Bar → Product → Daily lets you compare daily AI costs grouped by product.
Transactions Table
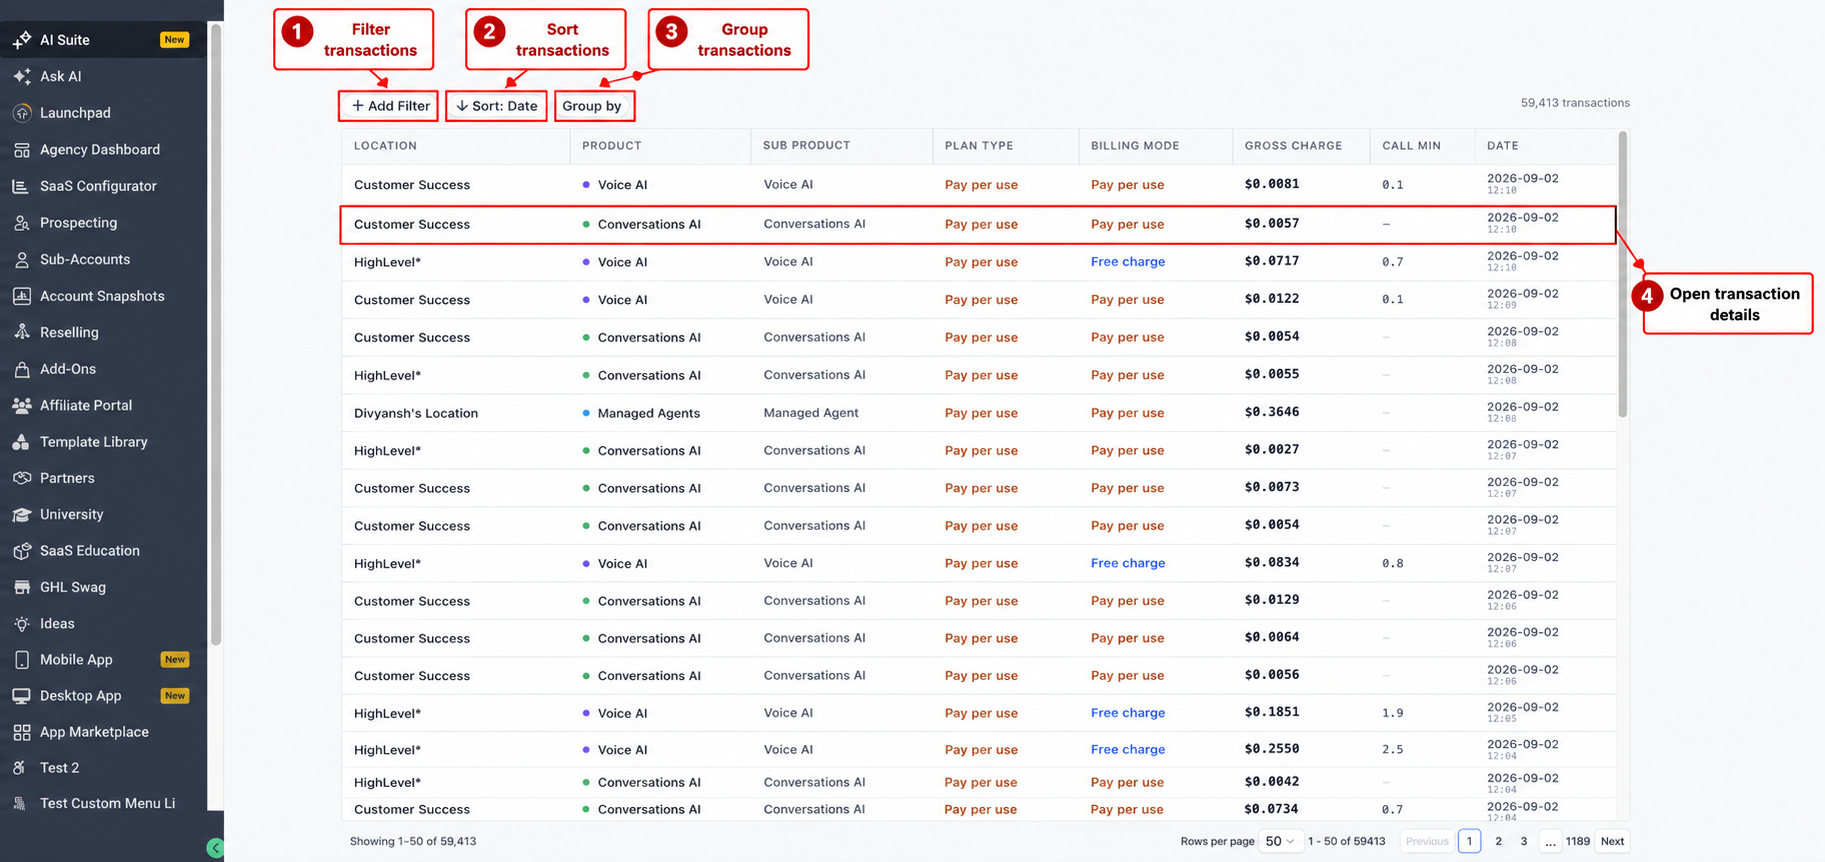
The Transactions Table provides the individual AI events behind the dashboard totals and charts. Reviewing this table is useful when you need to locate a specific charge, compare transactions across products or locations, or identify the event responsible for a particular usage record.
Scroll below the Usage over time chart until the Transactions Table appears.
Use the controls above the table to work with the displayed records:
- Select Add Filter to narrow the transaction list.
- Select Sort: Date to change the transaction order.
- Select Group by to organize related transactions.
- Select any transaction row to open its detailed record.
The Transactions Table can display:
- Location
- Product
- Sub Product
- Plan Type
- Billing Mode
- Gross Charge
- Call Min
- Date
Transaction Details
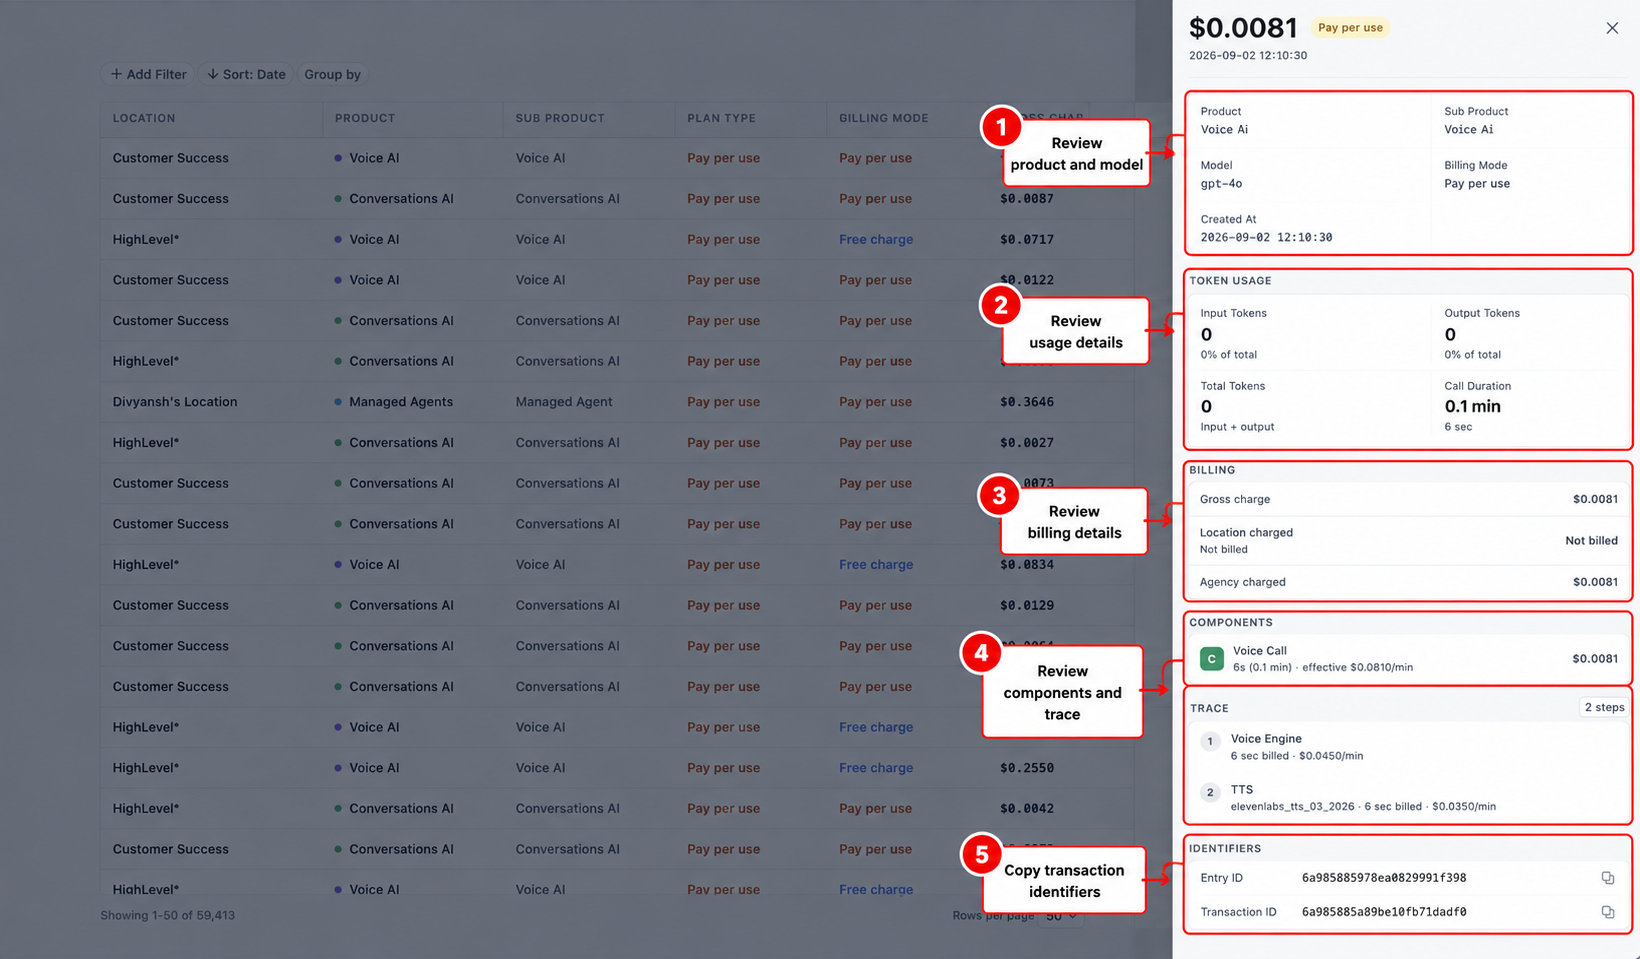
Transaction Details provide the most granular information available for an individual AI event. This view helps Agency Admins understand what product generated the event, how it was billed, what usage was recorded, and which components contributed to the transaction.
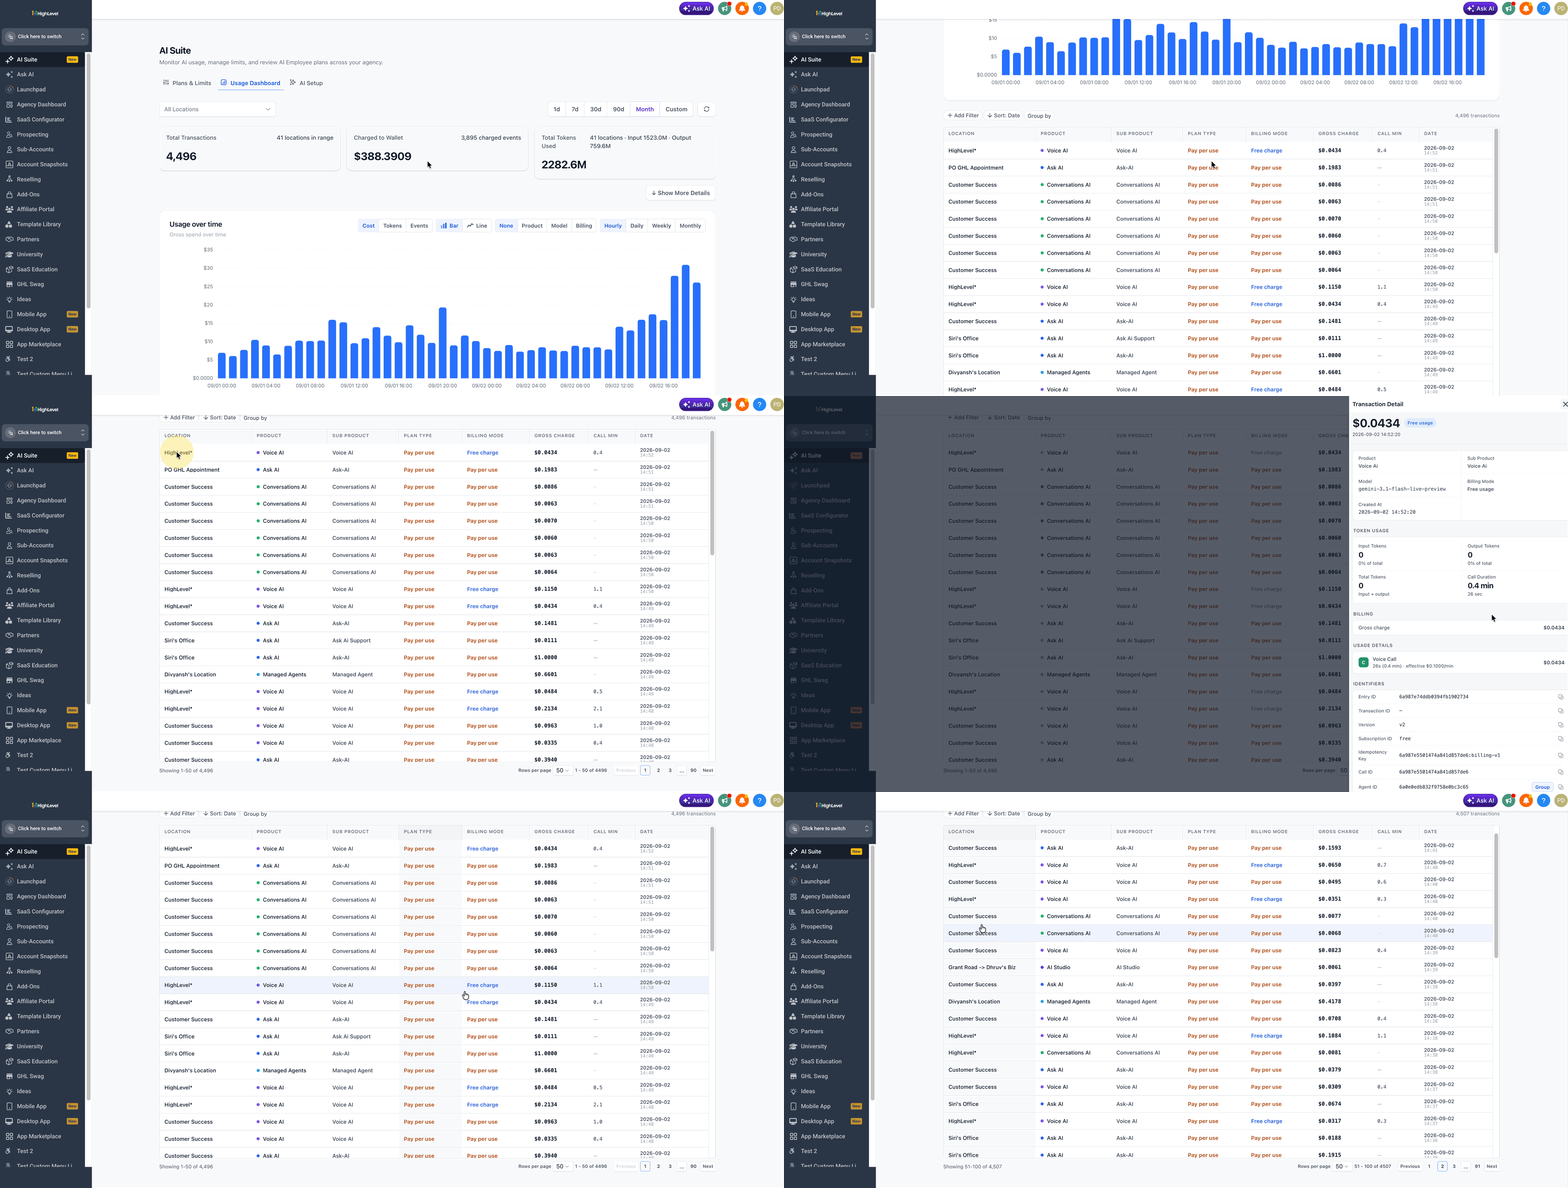
To open a transaction:
- Scroll to the Transactions Table.
- Locate the transaction you want to investigate.
- Select the transaction row.
- Review the Transaction Detail panel that opens on the right.
- Scroll through the panel when additional information is available.
Depending on the transaction type, the detail panel can include:
- Product
- Sub Product
- Model
- Billing Mode
- Created At
- Input Tokens
- Output Tokens
- Total Tokens
- Call Duration
- Gross Charge
- Location charged
- Agency charged
- Components
- Trace
- Entry ID
- Transaction ID
The information available can vary depending on the AI product. For example, a Voice AI transaction can display call duration and voice-processing components even when input and output token usage is zero.
Supported AI Products
Usage by Product helps Agency Admins identify which HighLevel AI products generated reportable activity within the selected Location and reporting period. Because the dashboard reflects actual usage, the products displayed can vary between agencies and date ranges.
Products visible in the current dashboard can include:
- Ask AI
- Managed Agents
- Voice AI
- Conversations AI
- AI Studio
- Performance AI
- Agent Studio
- Commerce
- Content AI Image
- Content AI Text
- Reviews AI
- Business Card Scanner AI
A product may not appear if it did not generate reportable activity within the selected Location and reporting period.
For current product-specific pricing and usage information, refer to AI Product Pricing.
How To Setup AI Usage Dashboard
The AI Usage Dashboard does not require a separate setup or configuration process before Agency Admins can begin reviewing activity. Using the dashboard effectively means selecting the appropriate reporting scope and moving from high-level usage totals to detailed transaction records when additional investigation is needed.
With your Agency View open, follow this complete workflow:
- Go to Agency View → AI Suite.
- Select Usage Dashboard.
- Choose All Locations or select the specific sub-account you want to review.
- Choose 1d, 7d, 30d, 90d, Month, or Custom for the reporting period.
- Review Total Transactions, Charged to Wallet, and Total Tokens Used.
- Select Show More Details to review Billing Coverage, Cost Breakdown, and Usage by Product.
- Use Usage over time to select a metric, chart type, grouping option, and time interval.
- Scroll to the Transactions Table.
- Use Add Filter, Sort: Date, or Group by when you need to narrow or organize the records.
- Select an individual transaction to review its detailed usage and billing information.
Note: Use AI Suite → Plans & Limits when you need to configure or review AI usage limits rather than investigate usage activity. For additional guidance, refer to AI Usage Limits.
Frequently Asked Questions
Q: Can sub-account users open the AI Usage Dashboard from their location?
No. The dashboard is accessed from the Agency level. Agency Admins can use the Location selector to review individual sub-account activity within the Agency-level dashboard.
Q: Why can Total Gross Usage be higher than Charged to Wallet?
Total Gross Usage represents usage before billing coverage is applied. Some activity may be covered by a subscription, promotion, or free/zero-charge billing instead of being charged directly to the agency wallet.
Q: Why do the products under Usage by Product change when I change the reporting period?
Usage by Product reflects reportable activity within the selected Location and reporting period. Products without activity in the selected scope may not appear.
Q: Why are some transaction fields blank?
The information available depends on the type of AI event. A field that does not apply to the selected transaction may not contain a value.
Q: Why might a transaction display Free charge?
Some AI activity can occur without a corresponding wallet charge. Review the transaction's billing information and the Billing Coverage area for additional context.
Q: Why might a Voice AI transaction show zero tokens?
Some Voice AI activity is represented through call duration and voice-related components rather than input and output token usage.
Q: What are Entry ID and Transaction ID used for?
These identifiers distinguish individual AI events and can help when reviewing or troubleshooting a specific transaction.
Q: Can I compare AI usage by model instead of product?
Yes. In the Usage over time chart, select Model from the grouping controls.
Related Articles
Was this article helpful?
That’s Great!
Thank you for your feedback
Sorry! We couldn't be helpful
Thank you for your feedback
Feedback sent
We appreciate your effort and will try to fix the article