Messaging Analytics gives HighLevel users a centralized view of SMS performance across a sub-account. The redesigned experience combines summary metrics, period-over-period comparisons, failure trends, opt-out monitoring, source filters, and detailed message logs.
Instead of relying only on total message counts, users can identify when delivery performance changes, determine why messages are failing, and investigate individual messages using detailed statuses and error codes.
This guide explains the current Messaging Analytics experience, dashboard metrics, filters, trend charts, detailed reporting, setup, troubleshooting, and how to turn analytics into actionable messaging improvements.
The dashboard’s failure-rate and opt-out markers are monitoring indicators. They do not replace the separate warning, sending-limit, or restriction rules defined by the LC Phone Messaging Policy.
What is Messaging Analytics?
Messaging Analytics is the reporting experience inside the HighLevel Phone System that helps users understand SMS delivery performance, incoming message activity, message failures, failure reasons, and subscriber opt-out behavior.
The dashboard combines high-level performance cards with trend charts and message-level logs. Users can compare performance with the previous reporting period, investigate sudden changes, and narrow outbound activity by messaging source.
Messaging Analytics is especially useful for sub-account owners, administrators, and agency teams that need to monitor deliverability and identify problems before they affect larger messaging workflows.
Key Benefits of Messaging Analytics
Messaging Analytics turns raw message activity into practical performance signals. Reviewing these signals regularly can help teams identify delivery problems sooner, protect sender reputation, and improve messaging practices.
- Performance Visibility: Track sent, delivered, failed, received, and opt-out performance from one dashboard.
- Trend Detection: Compare current performance with the previous reporting period and identify daily changes.
- Failure Diagnosis: Use failure reasons and message-level error codes to identify delivery blockers.
- Source-Level Analysis: Compare outbound activity from campaigns, workflows, and bulk messaging.
- Opt-Out Monitoring: Track unsubscribe trends that can indicate audience fatigue or consent-quality issues.
- Faster Troubleshooting: Click summary metrics to review individual messages, statuses, activity dates, and error codes.
What Changed in Messaging Analytics V2?
The redesigned Messaging Analytics experience adds trend analysis and diagnostic context that were not available in the previous raw-metric view. These changes make it easier to understand not only how many messages succeeded or failed, but also when performance changed and why.
| Area | Current Experience |
|---|---|
| Default Reporting Period | Last 30 days. |
| Maximum Date Range | Up to 90 days. |
| Summary Metrics | Sent, Delivered, Failed, Received, and Opt-Out Rate. |
| Performance Comparison | Period-over-period comparison indicators are displayed on summary metrics. |
| Trend Analysis | Failure Rate Trend and Opt-Out Rate Trend charts help identify performance changes over time. |
| Failure Diagnosis | Failure Reason Breakdown groups common causes so teams can focus on the highest-impact issues. |
| Detailed Logs | Summary cards open detailed message logs with contact, phone number, status, activity date, and error-code information. |
Error 30007 is no longer treated as a separate top-level summary metric. Carrier-filtering errors and other failure codes are investigated through Failed-message details, failure reasons, and detailed message logs.
Messaging Analytics Dashboard Metrics
The five summary cards provide a high-level view of message activity for the selected reporting period. Each card can also be used as an entry point for deeper message-level investigation.
| Metric | What It Represents | How to Use It |
|---|---|---|
| Sent | Messages the system attempted to send. | Use this as the baseline for evaluating outbound messaging volume and delivery performance. |
| Delivered | Messages that successfully reached the recipient. | Compare delivery performance across time periods and messaging sources. |
| Failed | Messages that could not be delivered because of issues such as invalid numbers, carrier filtering, opt-outs, or compliance restrictions. | Click the card and review error codes and failure reasons to identify the root cause. |
| Received | Inbound messages and replies received from contacts. | Use this to understand inbound messaging activity alongside outbound performance. |
| Opt-Out Rate | Percentage of contacts who replied with an opt-out keyword such as STOP or otherwise unsubscribed. | Monitor changes that could indicate audience fatigue, targeting problems, or consent-quality issues. |
Period-Over-Period Comparisons
Summary cards compare the selected reporting period with the previous equivalent period. Green and red visual indicators help surface positive or negative movement so unusual changes can be investigated without manually calculating differences.
Date Range and Messaging Source Filters
Date and source filters let you separate broad account-level changes from issues tied to a specific messaging activity. Start with the complete dataset, then narrow the view when you need to isolate campaign, workflow, or bulk-message performance.
Date Range
- The dashboard opens with the last 30 days selected by default.
- The reporting period can be expanded to up to 90 days for broader trend analysis.
Messaging Source Filters
| Filter | Use |
|---|---|
| All | View messaging performance across all supported sources. |
| Campaign | Review messages associated with campaign activity. |
| Workflow | Review messages triggered by workflow automation. |
| Bulk Request | Review messages sent through bulk messaging actions. |
Why did Opt-Out Rate disappear after applying a filter? Opt-out percentage is based on inbound opt-out activity, while Campaign, Workflow, and Bulk Request filters isolate outbound messaging sources. The Opt-Out Rate is therefore not displayed when those source filters are applied.
Charts and Trend Views
Trend charts add context to the summary metrics by showing when performance changed and what is contributing to message failures. Use them to spot spikes, isolate recurring problems, and monitor whether corrective changes are improving results.
Failure Rate Trend
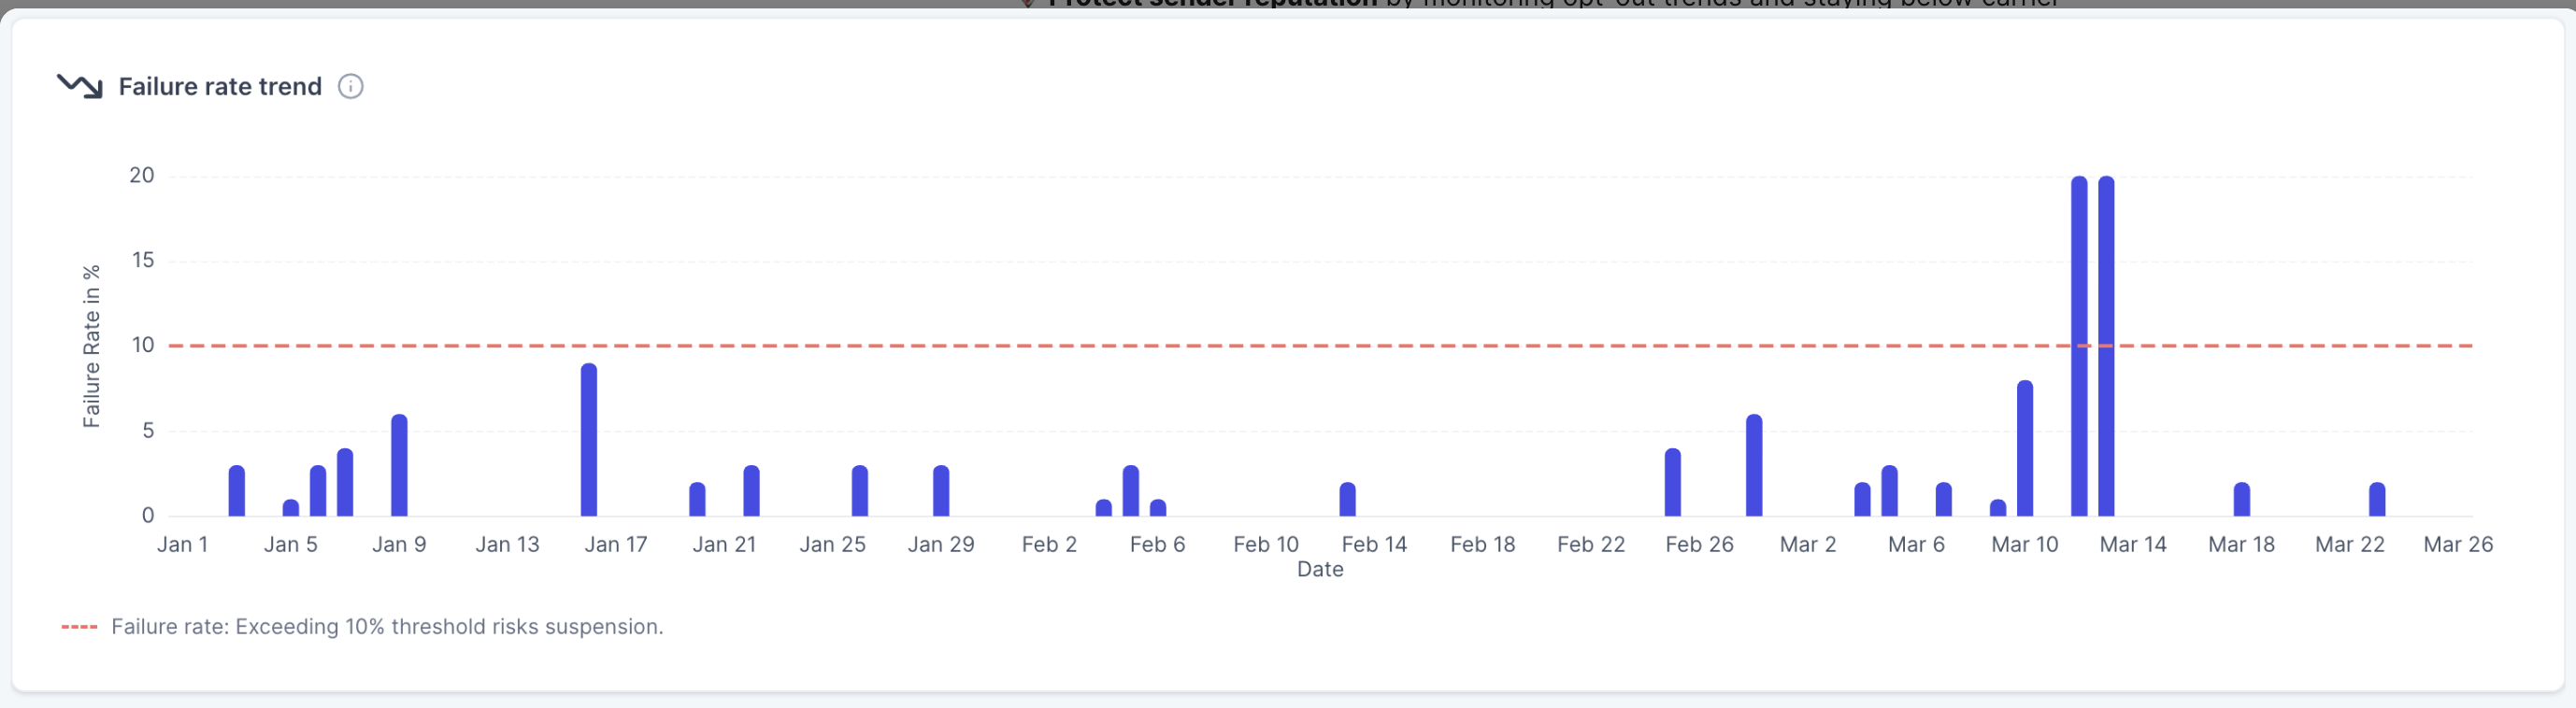
The Failure Rate Trend shows the percentage of failed messages over time. Each bar represents failure performance for a day within the selected date range, making sudden spikes easier to identify.
- Identify days when failures increased suddenly.
- Compare recurring patterns across the selected period.
- Use the chart’s 10% reference line as a signal that delivery performance requires closer review.
Failure Reason Breakdown
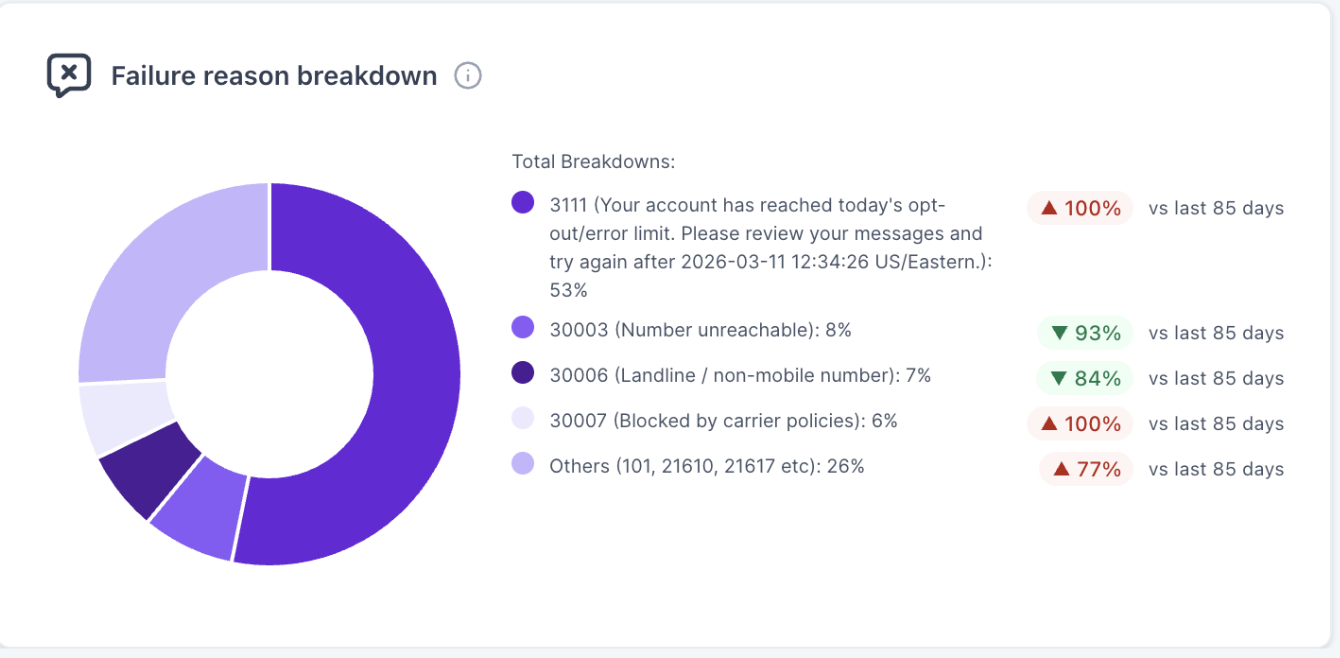
The Failure Reason Breakdown groups failed messaging into categories and shows the percentage each cause contributes to the overall failure total. Common examples include:
- Unverified toll-free numbers
- Invalid or non-mobile numbers
- Carrier filtering or carrier safeguards
- Country mismatches or routing issues
Opt-Out Rate Trend
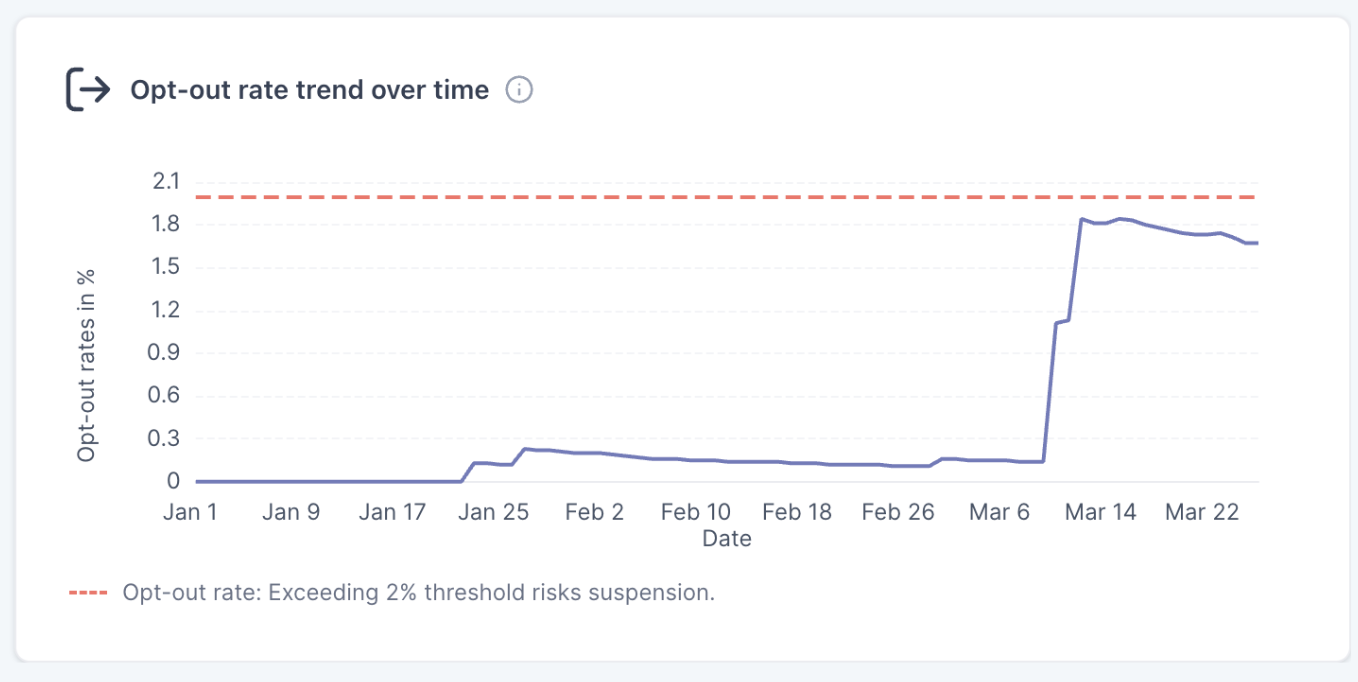
The Opt-Out Rate Trend shows how recipient unsubscribe behavior changes over time. A rising opt-out rate can signal that targeting, consent quality, message frequency, or content should be reviewed.
The chart includes a 2% reference marker to surface elevated opt-out behavior.
Thresholds require context: The 10% failure and 2% opt-out lines are analytics reference markers. Messaging-policy warnings and suspensions use separate criteria based on factors such as sending volume, ramp level, error count, and opt-out performance. HighLevel generally considers an opt-out rate of approximately 0–1% healthy.
Detailed Message Reporting
Summary metrics identify that something changed; detailed message logs help explain the individual messages behind that change. Use the logs to move from account-level trends to specific contacts, statuses, activity dates, and error codes.
Click any of the following summary cards:
- Sent
- Delivered
- Failed
- Received
- Opt-Out Rate
The detailed logs modal can include:
| Detail | Why It Matters |
|---|---|
| Contact Name | Identifies the contact associated with the message. |
| Phone Number | Helps identify destination-specific or number-quality problems. |
| Status | Shows the delivery state associated with the message. |
| Activity Date | Connects individual messages to spikes or changes on the trend charts. |
| Error Code | Provides the technical reason needed to troubleshoot unsuccessful delivery. |
How to Use Messaging Analytics
Follow these steps to access Messaging Analytics, adjust the reporting period and filters, review dashboard metrics, and analyze messaging trends.
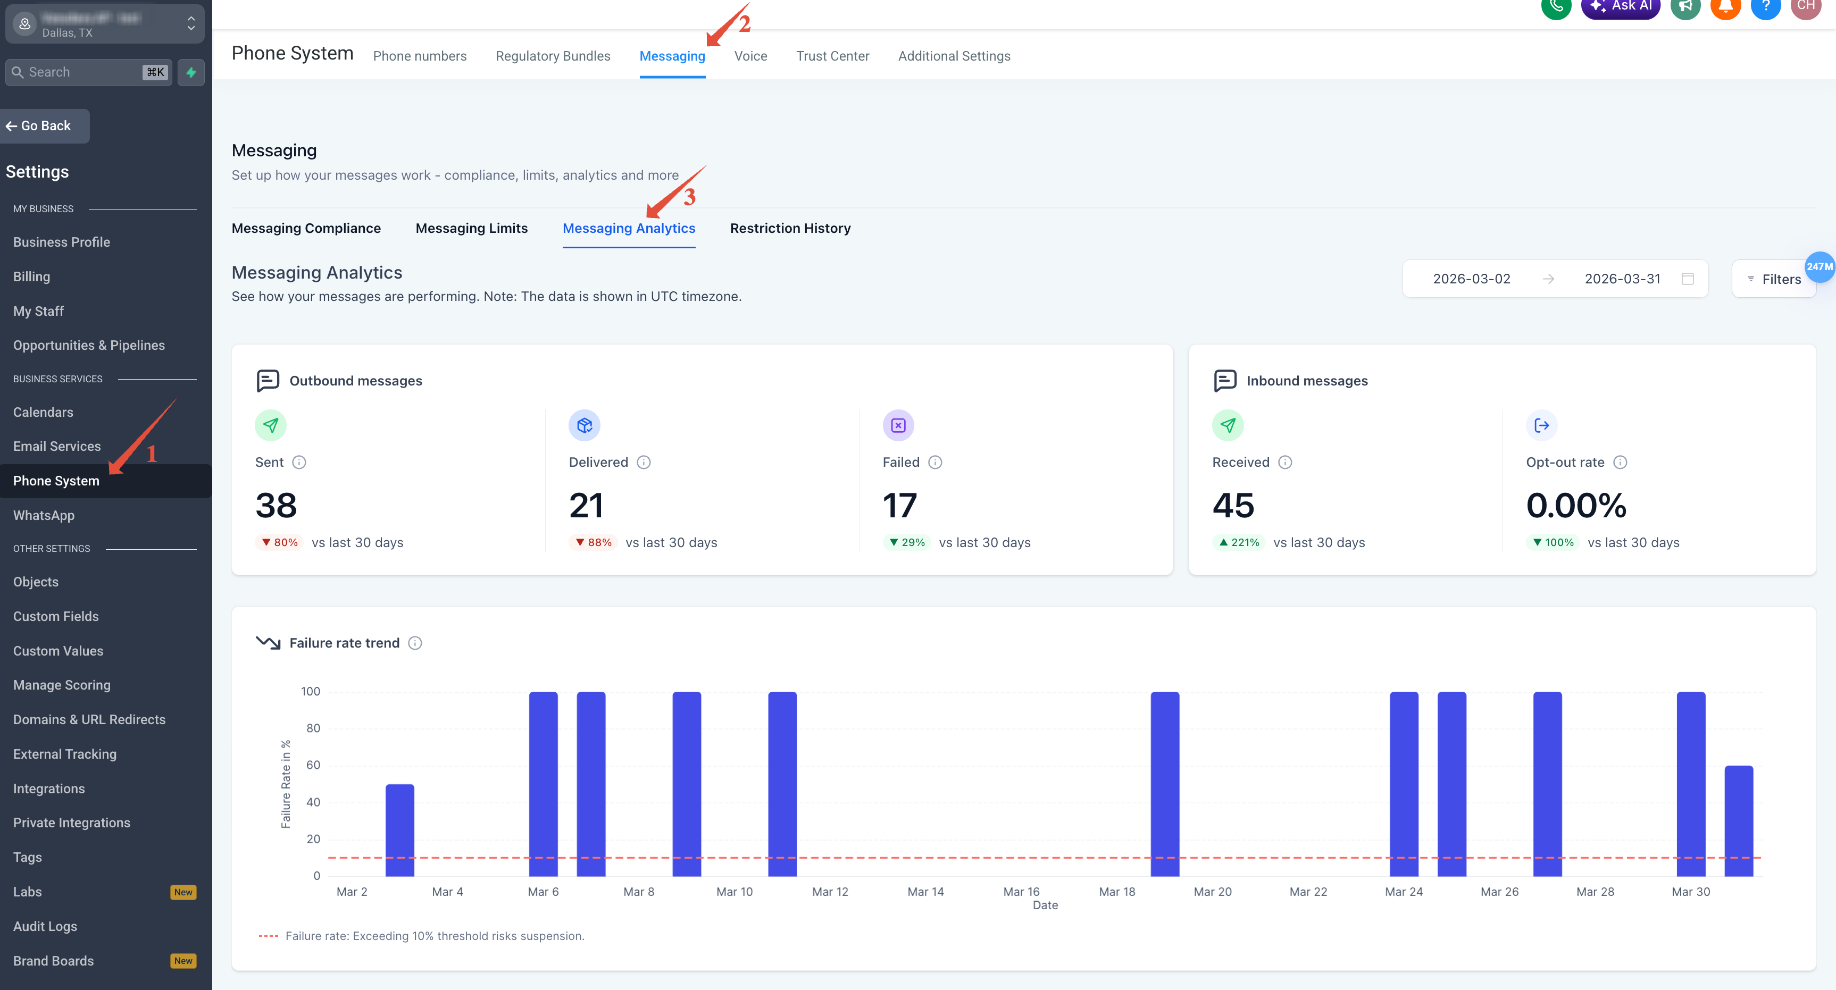
Step 1: Where to Find It
- Go to Settings
- Click Phone System
- Open the Messaging tab
- Select Messaging Analytics
Step 2: Date Range & Filters
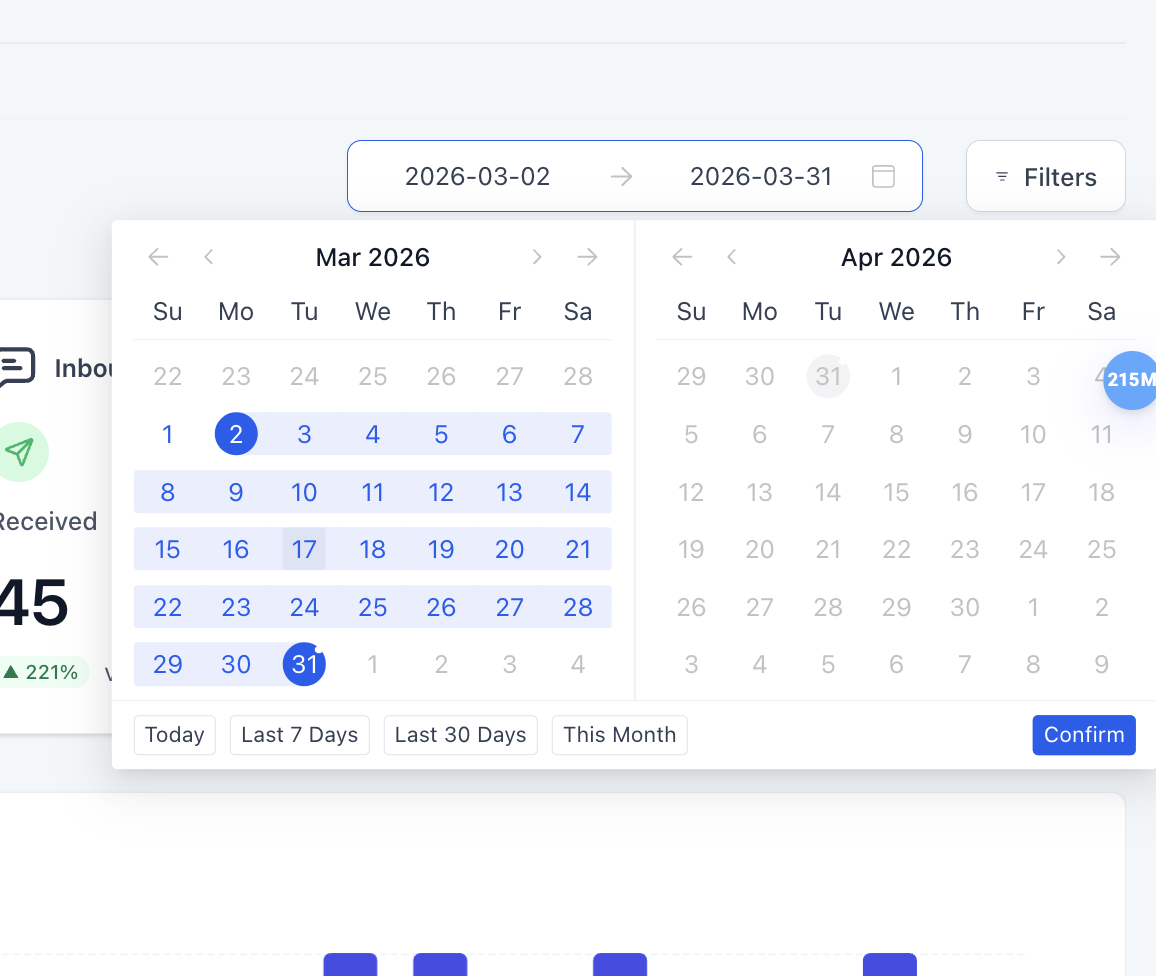
- The default view shows the last 30 days (previously 7 days)
- You can select up to 90 days for a broader analysis
- Use filters to refine your data and focus on specific insights
Step 3: Dashboard Overview
The top of the dashboard displays five key metrics:
| Metric | Description |
|---|---|
| Sent | Total messages your system attempted to send |
| Delivered | Messages that successfully reached the recipient |
| Failed | Messages that could not be delivered (invalid numbers, carrier filtering, opt-outs, compliance issues) |
| Received | Inbound messages and replies from contacts |
| Opt-Out Rate | Percentage of contacts who replied STOP or otherwise unsubscribed |
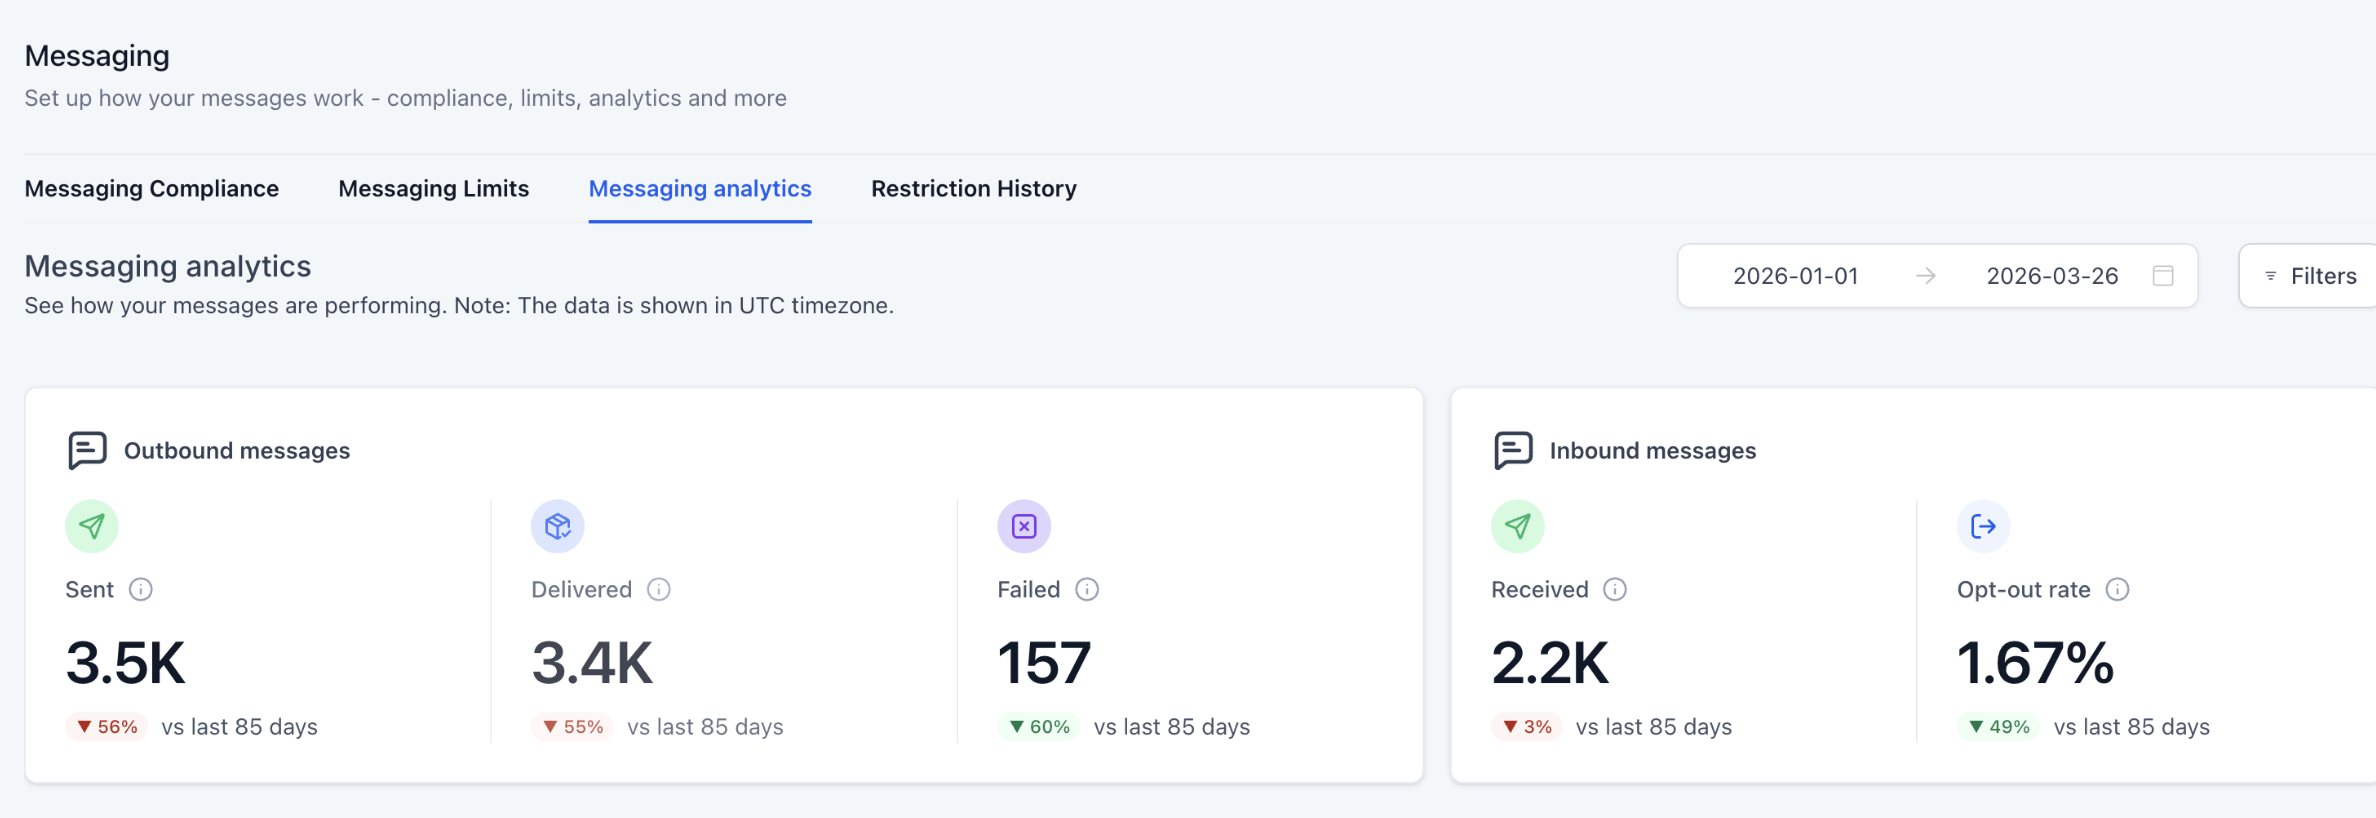
Each metric includes a comparison to the previous time period (e.g., vs last 30 days), along with visual indicators:
- Green = Improvement
- Red = Decline
This helps you quickly identify trends without manual analysis.
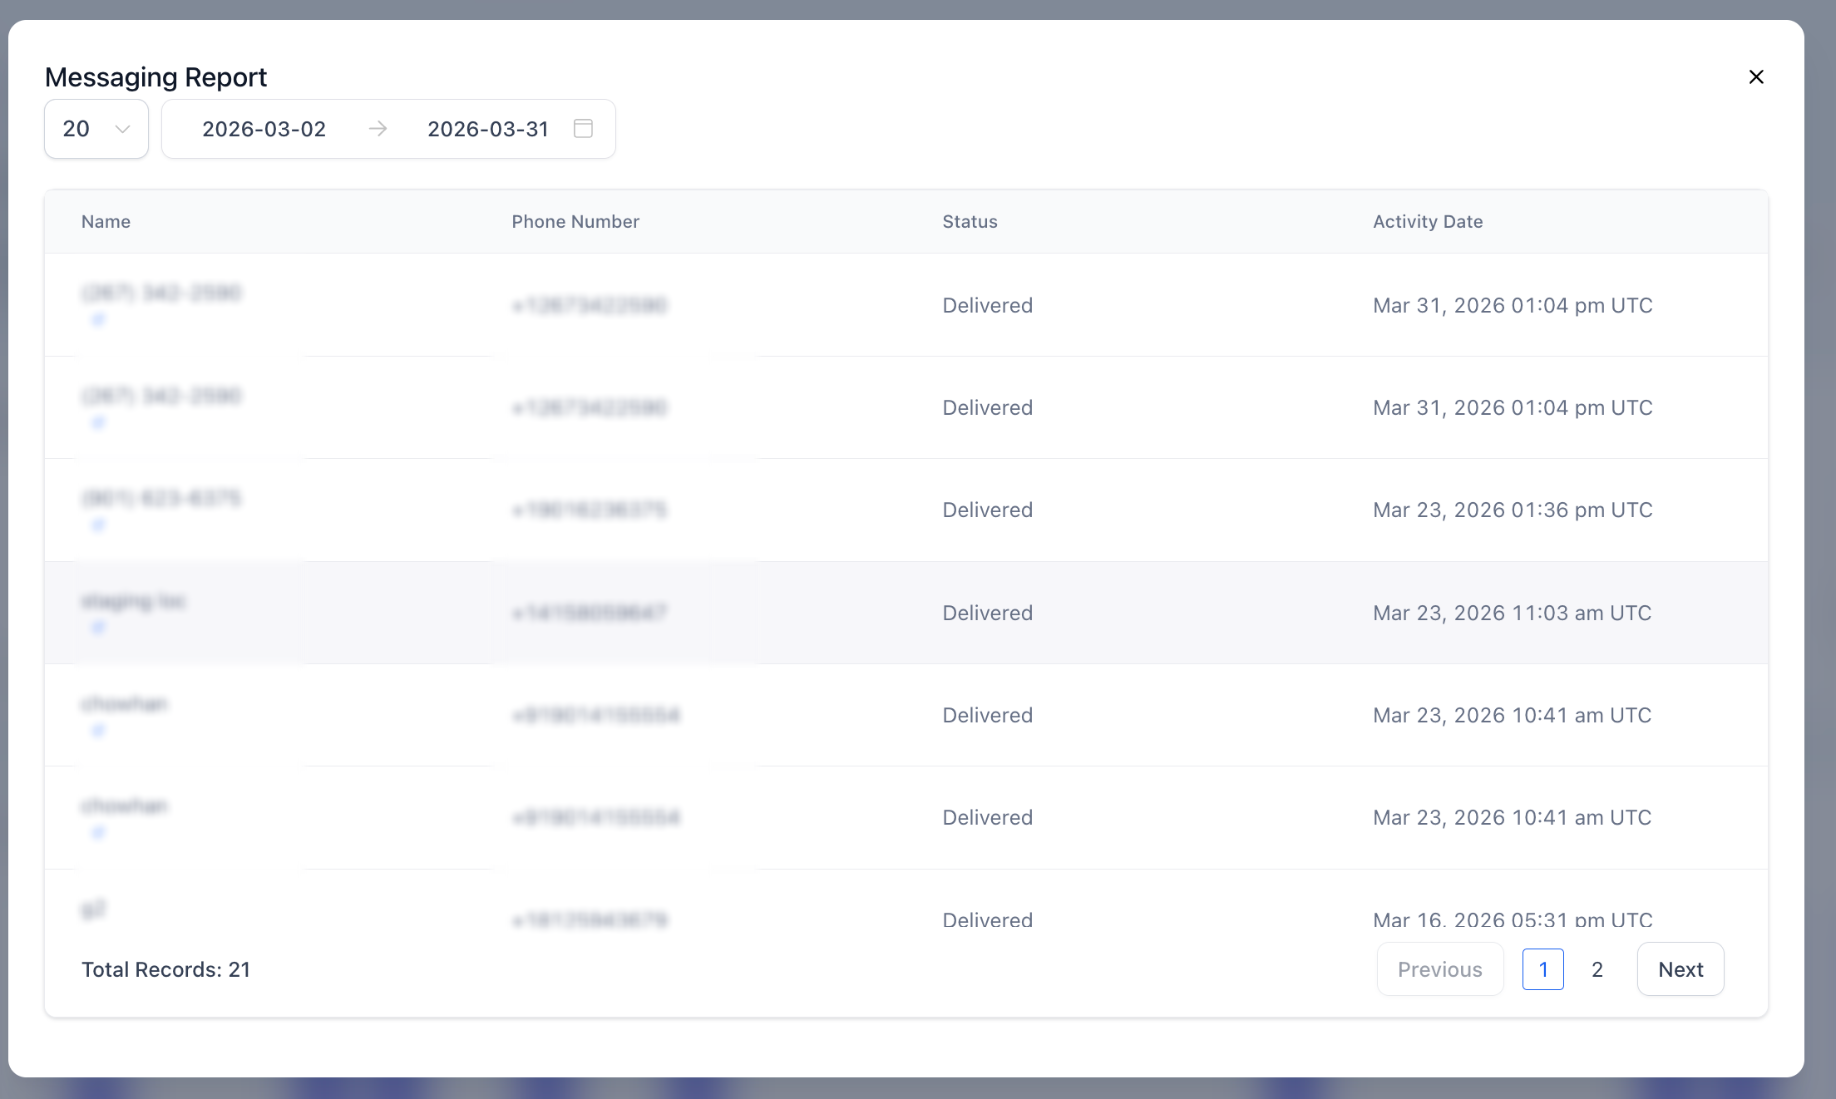
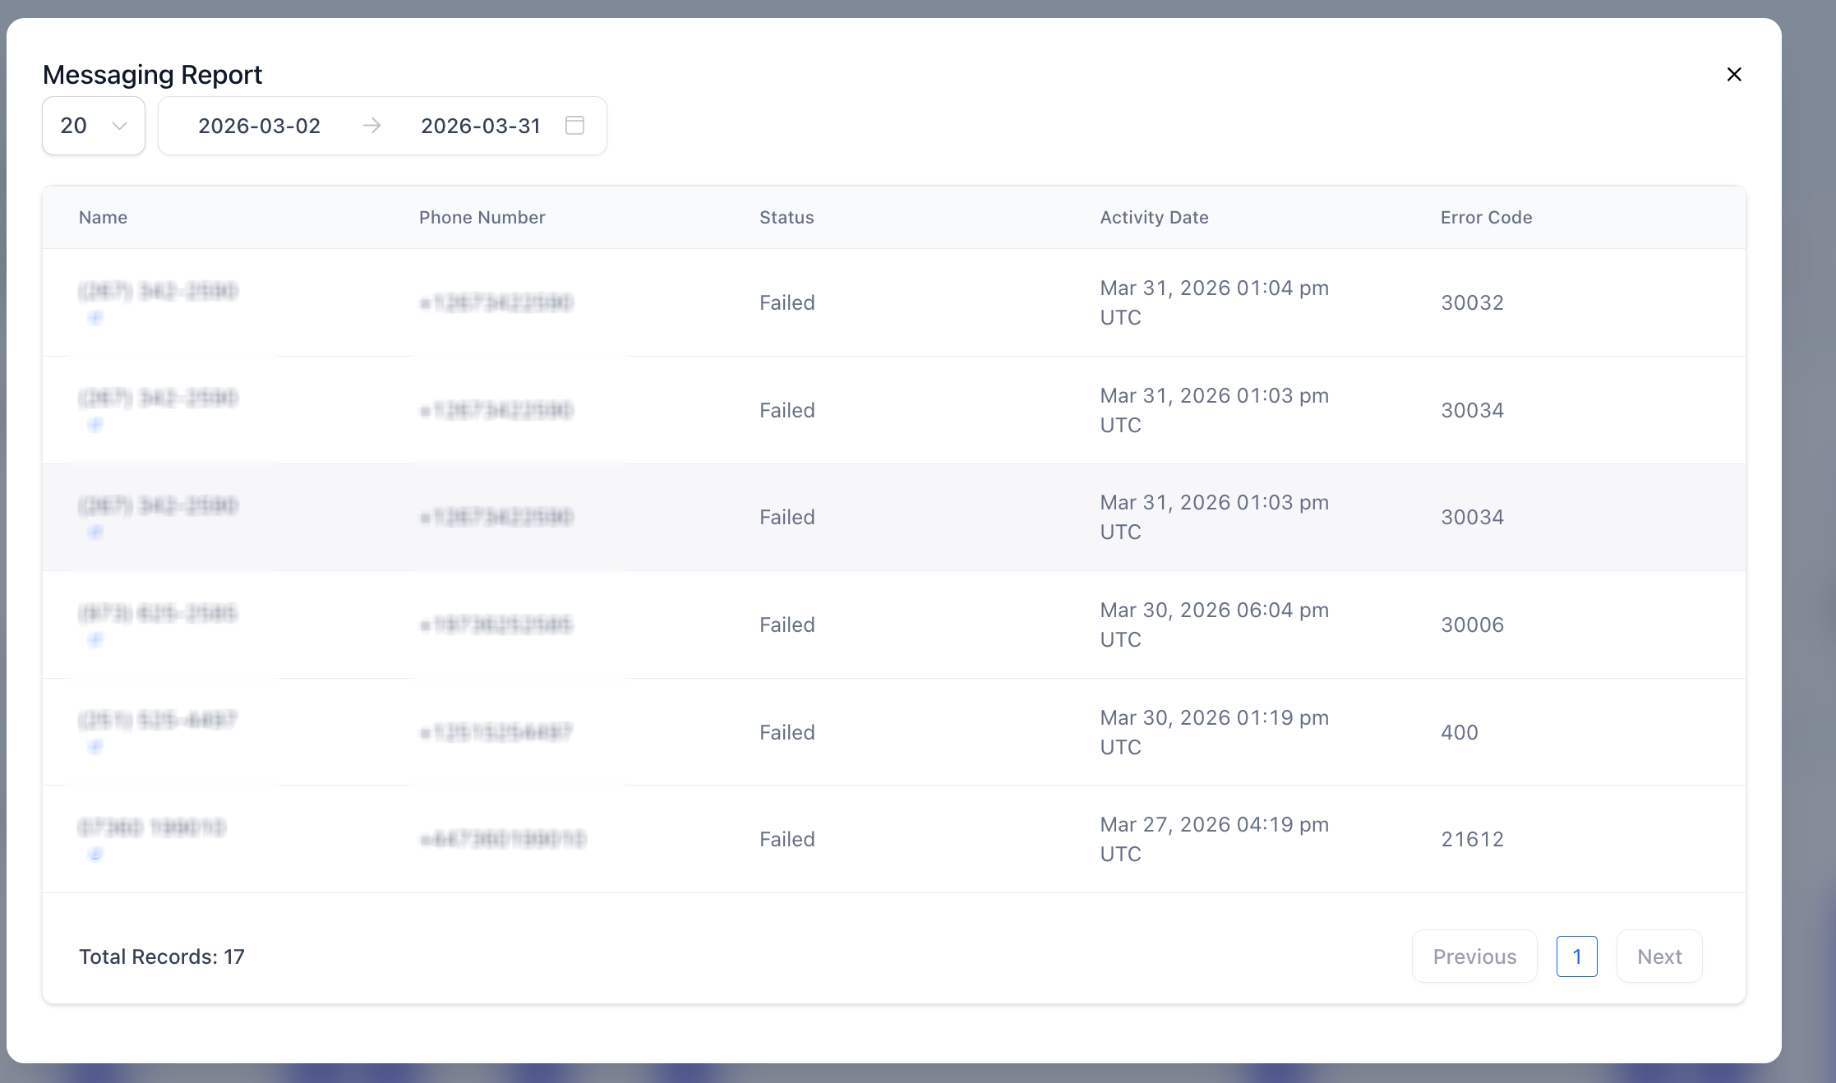
Every summary card is now clickable. Click on Sent, Delivered, Failed, Received, or Opt-Out Rate to open a detailed logs modal showing:
- Name
- Phone number
- Status
- Activity Date
- Error codes
This allows you to quickly investigate individual messages and troubleshoot issues with precision.
Step 4: Charts & Trend Views
The Failure Rate Trend chart shows how your message failure rate changes over time, helping you quickly spot patterns and potential issues. Each bar represents the percentage of messages that failed on a given day within your selected date range.
- Daily performance visibility — see exactly when failures occurred instead of relying on overall averages.
- Identify spikes and patterns — sudden increases may indicate carrier filtering, invalid contact data, or compliance problems.
- Monitor consistency — a steady rate suggests stable performance, while fluctuations may signal issues that need attention.
Threshold indicator: the chart includes a 10% threshold line (shown as a dotted red line).
- Staying below 10% → healthy messaging performance
- Going above 10% → increased risk of carrier restrictions or account limitations
Repeatedly exceeding this threshold can negatively impact your sender reputation and may lead to messaging suspension.
The Failure Reason Breakdown donut chart shows why your messages failed, giving you a clear view of the most common issues affecting delivery. Each segment represents a specific failure reason along with its percentage contribution.
Common failure reasons include:
- Unverified toll-free numbers
- Invalid or non-mobile numbers
- Carrier filtering or safeguards
- Country mismatches or routing issues
You'll also see how each reason has changed compared to the previous period.
How to use it
- Identify the top causes of failures
- Focus on fixing the highest-impact issues first
- Track improvements over time with period comparisons
This helps you move from guesswork to precise fixes, improving deliverability faster.
Monitor how many recipients are opting out of your messages over time.
- Includes a 2% threshold marker
- Helps you maintain healthy engagement
- Supports better messaging practices and compliance
How to Use Messaging Analytics to Improve Performance
Analytics is most useful when each signal leads to a specific investigation or corrective action. Start with the trend that changed, identify the messages behind it, and then address the highest-impact failure or compliance issue first.
| What You Notice | Recommended Next Step |
|---|---|
| Failure rate rises suddenly | Review the Failure Reason Breakdown, then open Failed-message logs and inspect the most common error codes. |
| Error 30007 appears frequently | Review message content, sender identity, consent, and applicable carrier-compliance requirements because Error 30007 indicates carrier filtering. |
| Invalid or non-mobile numbers dominate failures | Review list quality and remove or correct contacts that cannot receive SMS. |
| Opt-out rate increases | Review consent quality, audience targeting, message frequency, sender identification, and opt-out language. |
| One source performs worse than others | Filter by Campaign, Workflow, or Bulk Request and compare the affected source against overall account performance. |
| Failure or opt-out trends remain elevated | Pause or adjust problematic messaging activity and review the LC Phone Messaging Policy before continuing high-volume sending. |
Troubleshooting Messaging Analytics
Most analytics issues can be narrowed down by confirming the reporting period and removing source filters before investigating message-level delivery problems.
Check the selected date range and messaging-source filter. Set the filter to All and expand the reporting period when necessary.
This is expected when an outbound source filter such as Campaign, Workflow, or Bulk Request is applied. Return the source filter to All to review the overall Opt-Out Rate.
Review the Failure Reason Breakdown first, then click the Failed metric to inspect individual error codes. Resolve the largest failure category before retrying or increasing messaging volume.
Error 30007 is a carrier-filtering response. Review message content, consent, sender identification, registration requirements, and carrier-compliance practices before retrying.
Treat the marker as a signal to investigate immediately. Review message sources, detailed error codes, consent practices, list quality, and the current LC Phone Messaging Policy because repeated poor performance can increase the risk of messaging restrictions.
Frequently Asked Questions
Was this article helpful?
That’s Great!
Thank you for your feedback
Sorry! We couldn't be helpful
Thank you for your feedback
Feedback sent
We appreciate your effort and will try to fix the article