The Summary section in Email Statistics provides a complete overview of your campaign’s performance after it’s been sent. It displays delivery, open, and engagement rates, helping you quickly understand how recipients interacted with your email.
This article explains how to access the Summary page, what each metric means, and how to interpret your campaign’s performance data.
TABLE OF CONTENTS
- What is the Summary Page in Email Statistics?
- How to Access the Summary Page
- Understanding Summary Metrics
- Engagement Analysis Chart
- Conversion Summary and Analysis
- Details Tab Overview
- Frequently Asked Questions
What is the Summary Page in Email Statistics?
The Summary Page gives you an at-a-glance view of your email campaign’s performance. It includes engagement metrics like delivery, open, click, and bounce rates, as well as unsubscribe and spam statistics.
You can also view engagement trends over time, analyse conversions, and access detailed recipient-level data such as who opened, clicked, or unsubscribed from your email.
How to Access the Summary Page
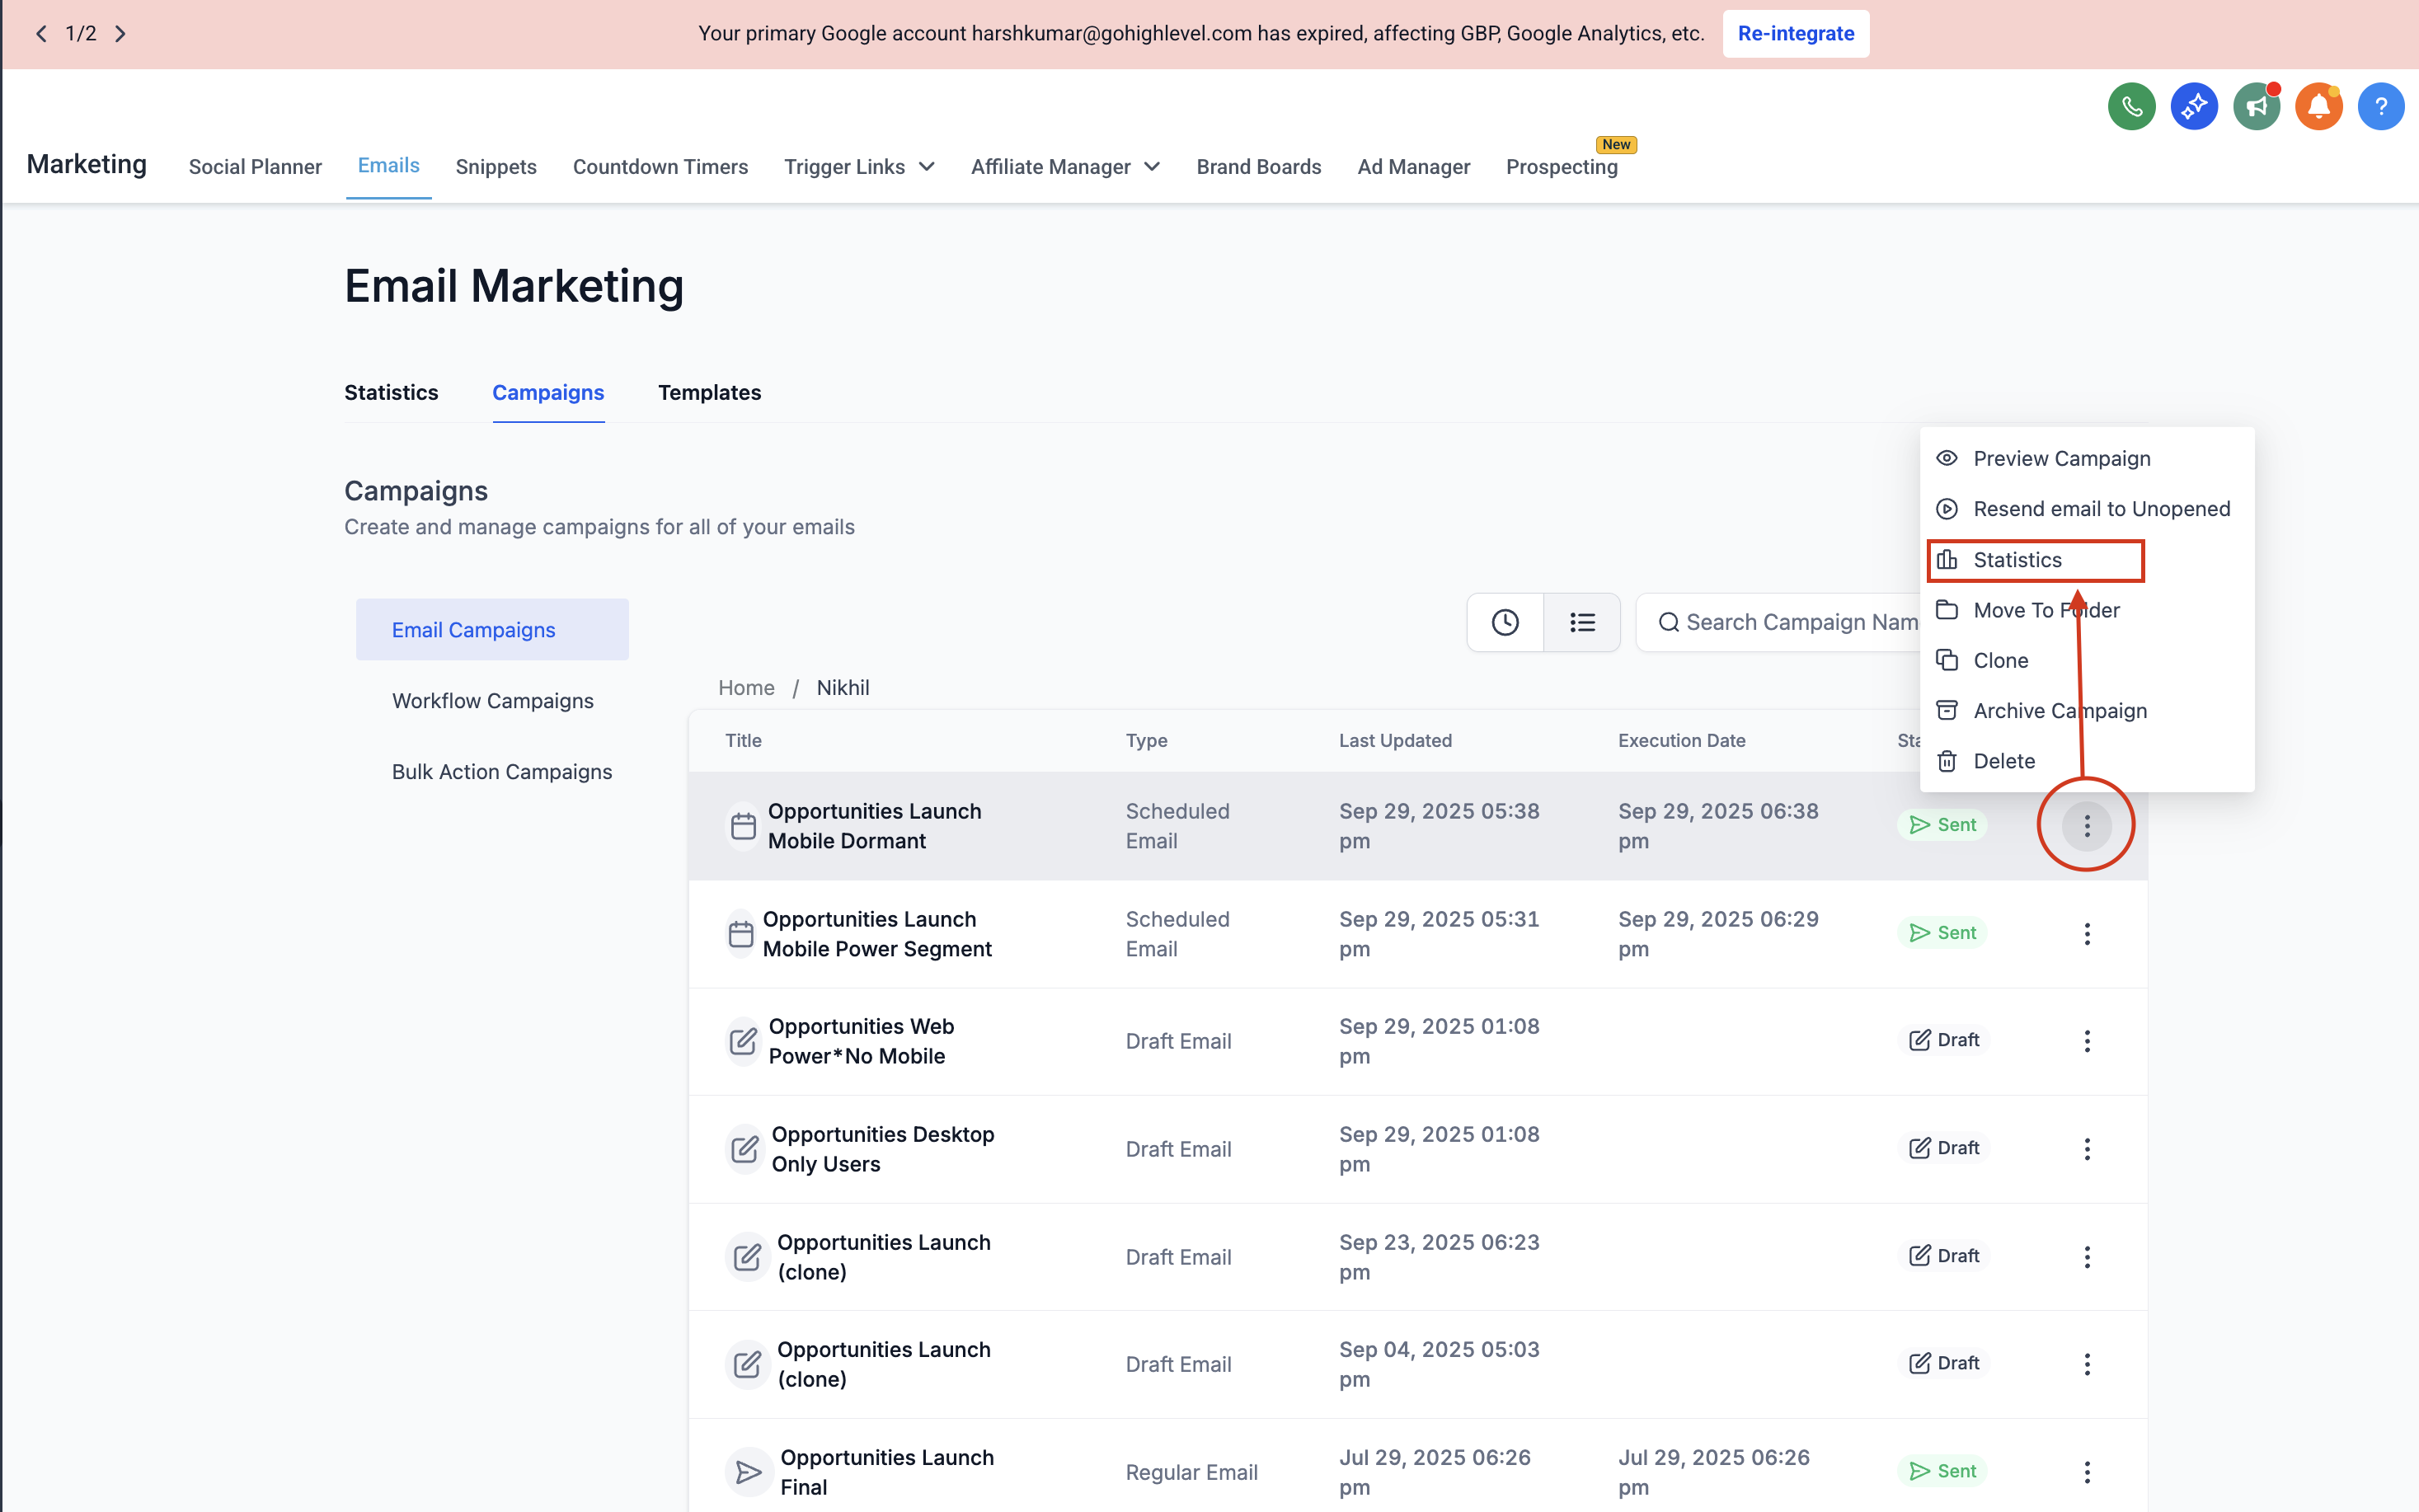
Navigate to Marketing → Emails from your dashboard.
Go to the Campaigns tab.

Locate your sent email campaign.
Click on the three-dot menu (⋮) next to the campaign name.
Select “Statistics.”
In the stats side panel that opens, click “Load More Statistics.”
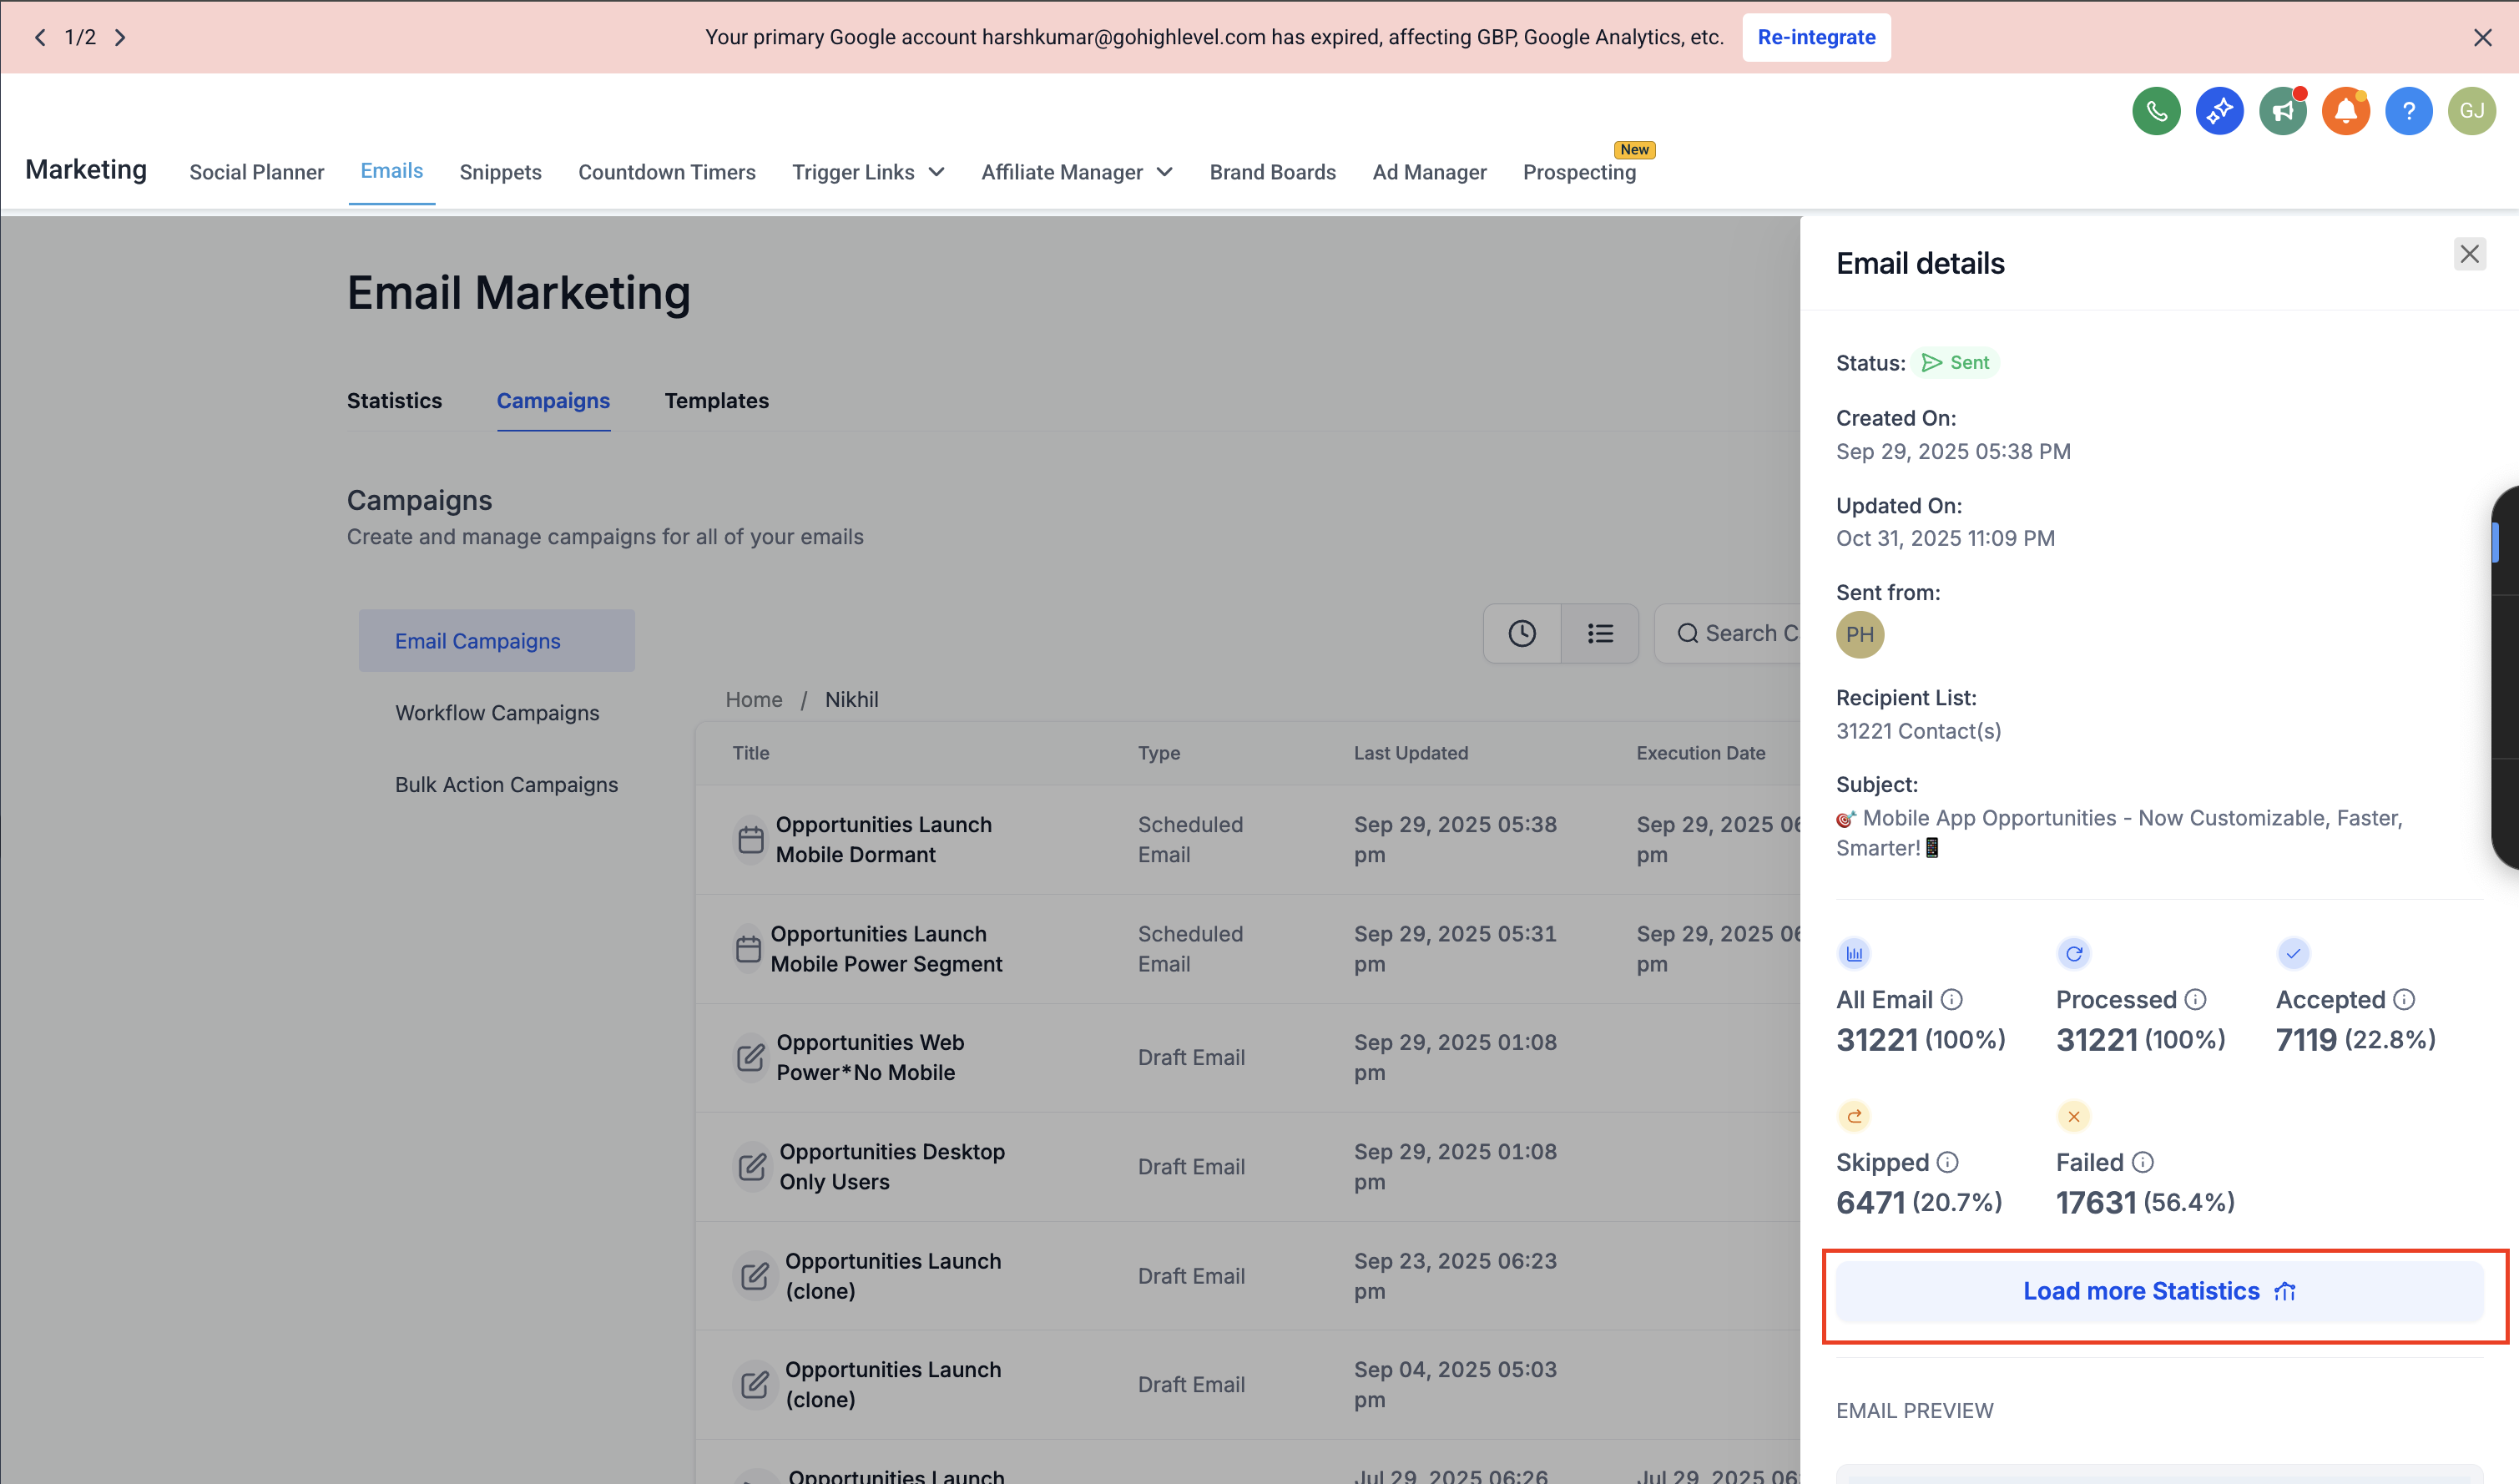
On the full statistics page, select the Summary tab at the top.

Understanding Summary Metrics
Delivered
The percentage of emails that were successfully delivered to recipients’ inboxes (out of all emails sent).
Formula: (Delivered / Total Sent) × 100
A high delivery rate (90%+) indicates good sender reputation and clean contact lists.
Opened
The percentage of recipients who opened your email at least once.
Formula: (Unique Opens / Delivered) × 100
This helps measure how effective your subject line and sender name are at grabbing attention.
Clicked
The percentage of recipients who clicked at least one link in your email.
Formula: (Unique Clicks / Delivered) × 100
A higher click rate shows strong engagement and effective content or CTA placement.
Conversion
The percentage of recipients who completed a desired action (like a purchase, booking, or signup) after clicking through your email.
Formula: (Conversions / Delivered) × 100
If conversions are tracked, this metric helps evaluate campaign ROI and goal success.
Soft Bounced
Emails that were temporarily undeliverable due to issues like a full inbox or temporary server problem.
Tip: These may still succeed if retried later.
Hard Bounced
Emails that failed permanently, for example, invalid addresses or blocked domains.
Tip: Regularly clean your contact list to avoid high hard bounce rates (keep below 2%).
Unsubscribed
The percentage of recipients who opted out using your unsubscribe link.
Formula: (Unsubscribed / Delivered) × 100
A small unsubscribe rate (under 1%) is normal, but higher numbers may indicate irrelevant content or excessive frequency.
Skipped
When the email is ready to go but skipped due to most likely
- Any internal issue while sending the email to specific contact
- If contact is dnd
Spam
The percentage of emails reported as spam by recipients.
Tip: Maintain a healthy sending reputation by avoiding spam-triggering keywords and ensuring audience relevance.
Engagement Analysis Chart
Below the summary, the Engagement Analysis graph visually displays your campaign’s key performance trends —
Delivered (green line)
Opened (blue line)
Clicked (orange line)
You can view engagement activity across selected date ranges to identify when most interactions occurred.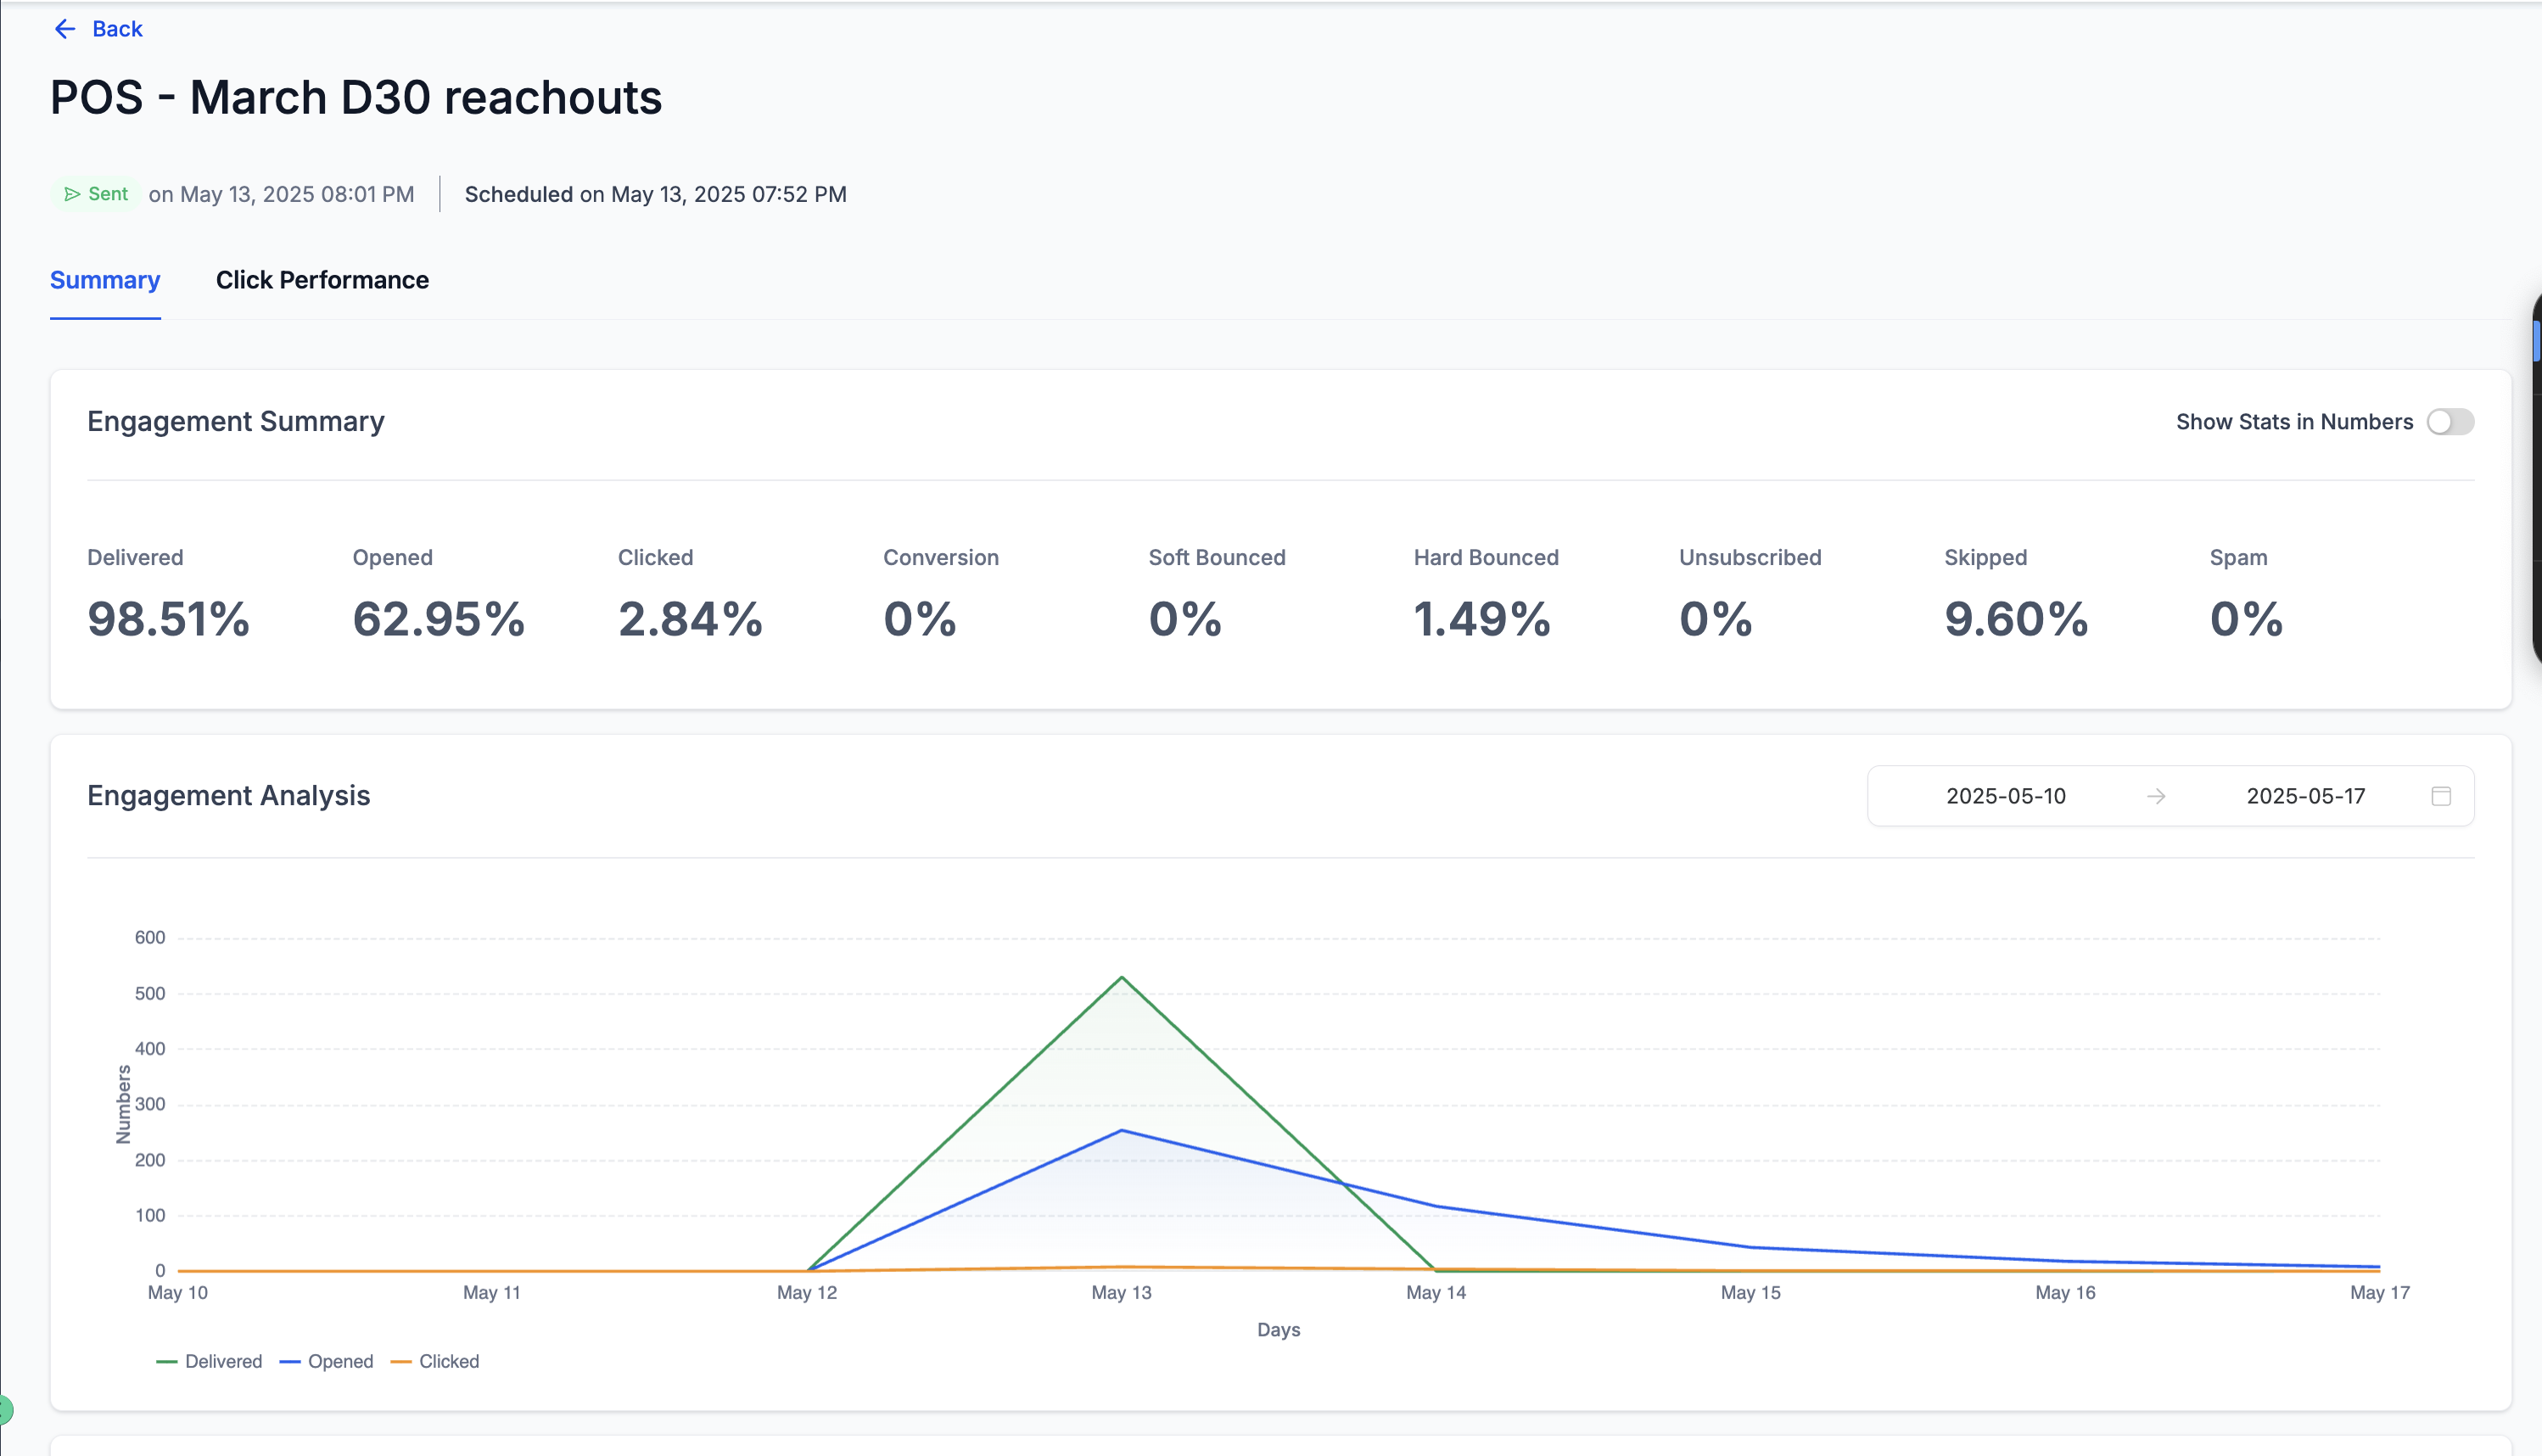
Tip: Peaks in the chart often indicate the best-performing send days or hours for your audience.
Conversion Summary and Analysis
If your campaign includes e-commerce or goal-tracking setup, this section displays:
Revenue: Total income generated from the email.
RPR (Revenue per Recipient): Average revenue earned per recipient.
Conversion Analysis Chart: Tracks the number of orders or conversions over time.
Note: If revenue tracking isn’t set up, these fields will display as $0.

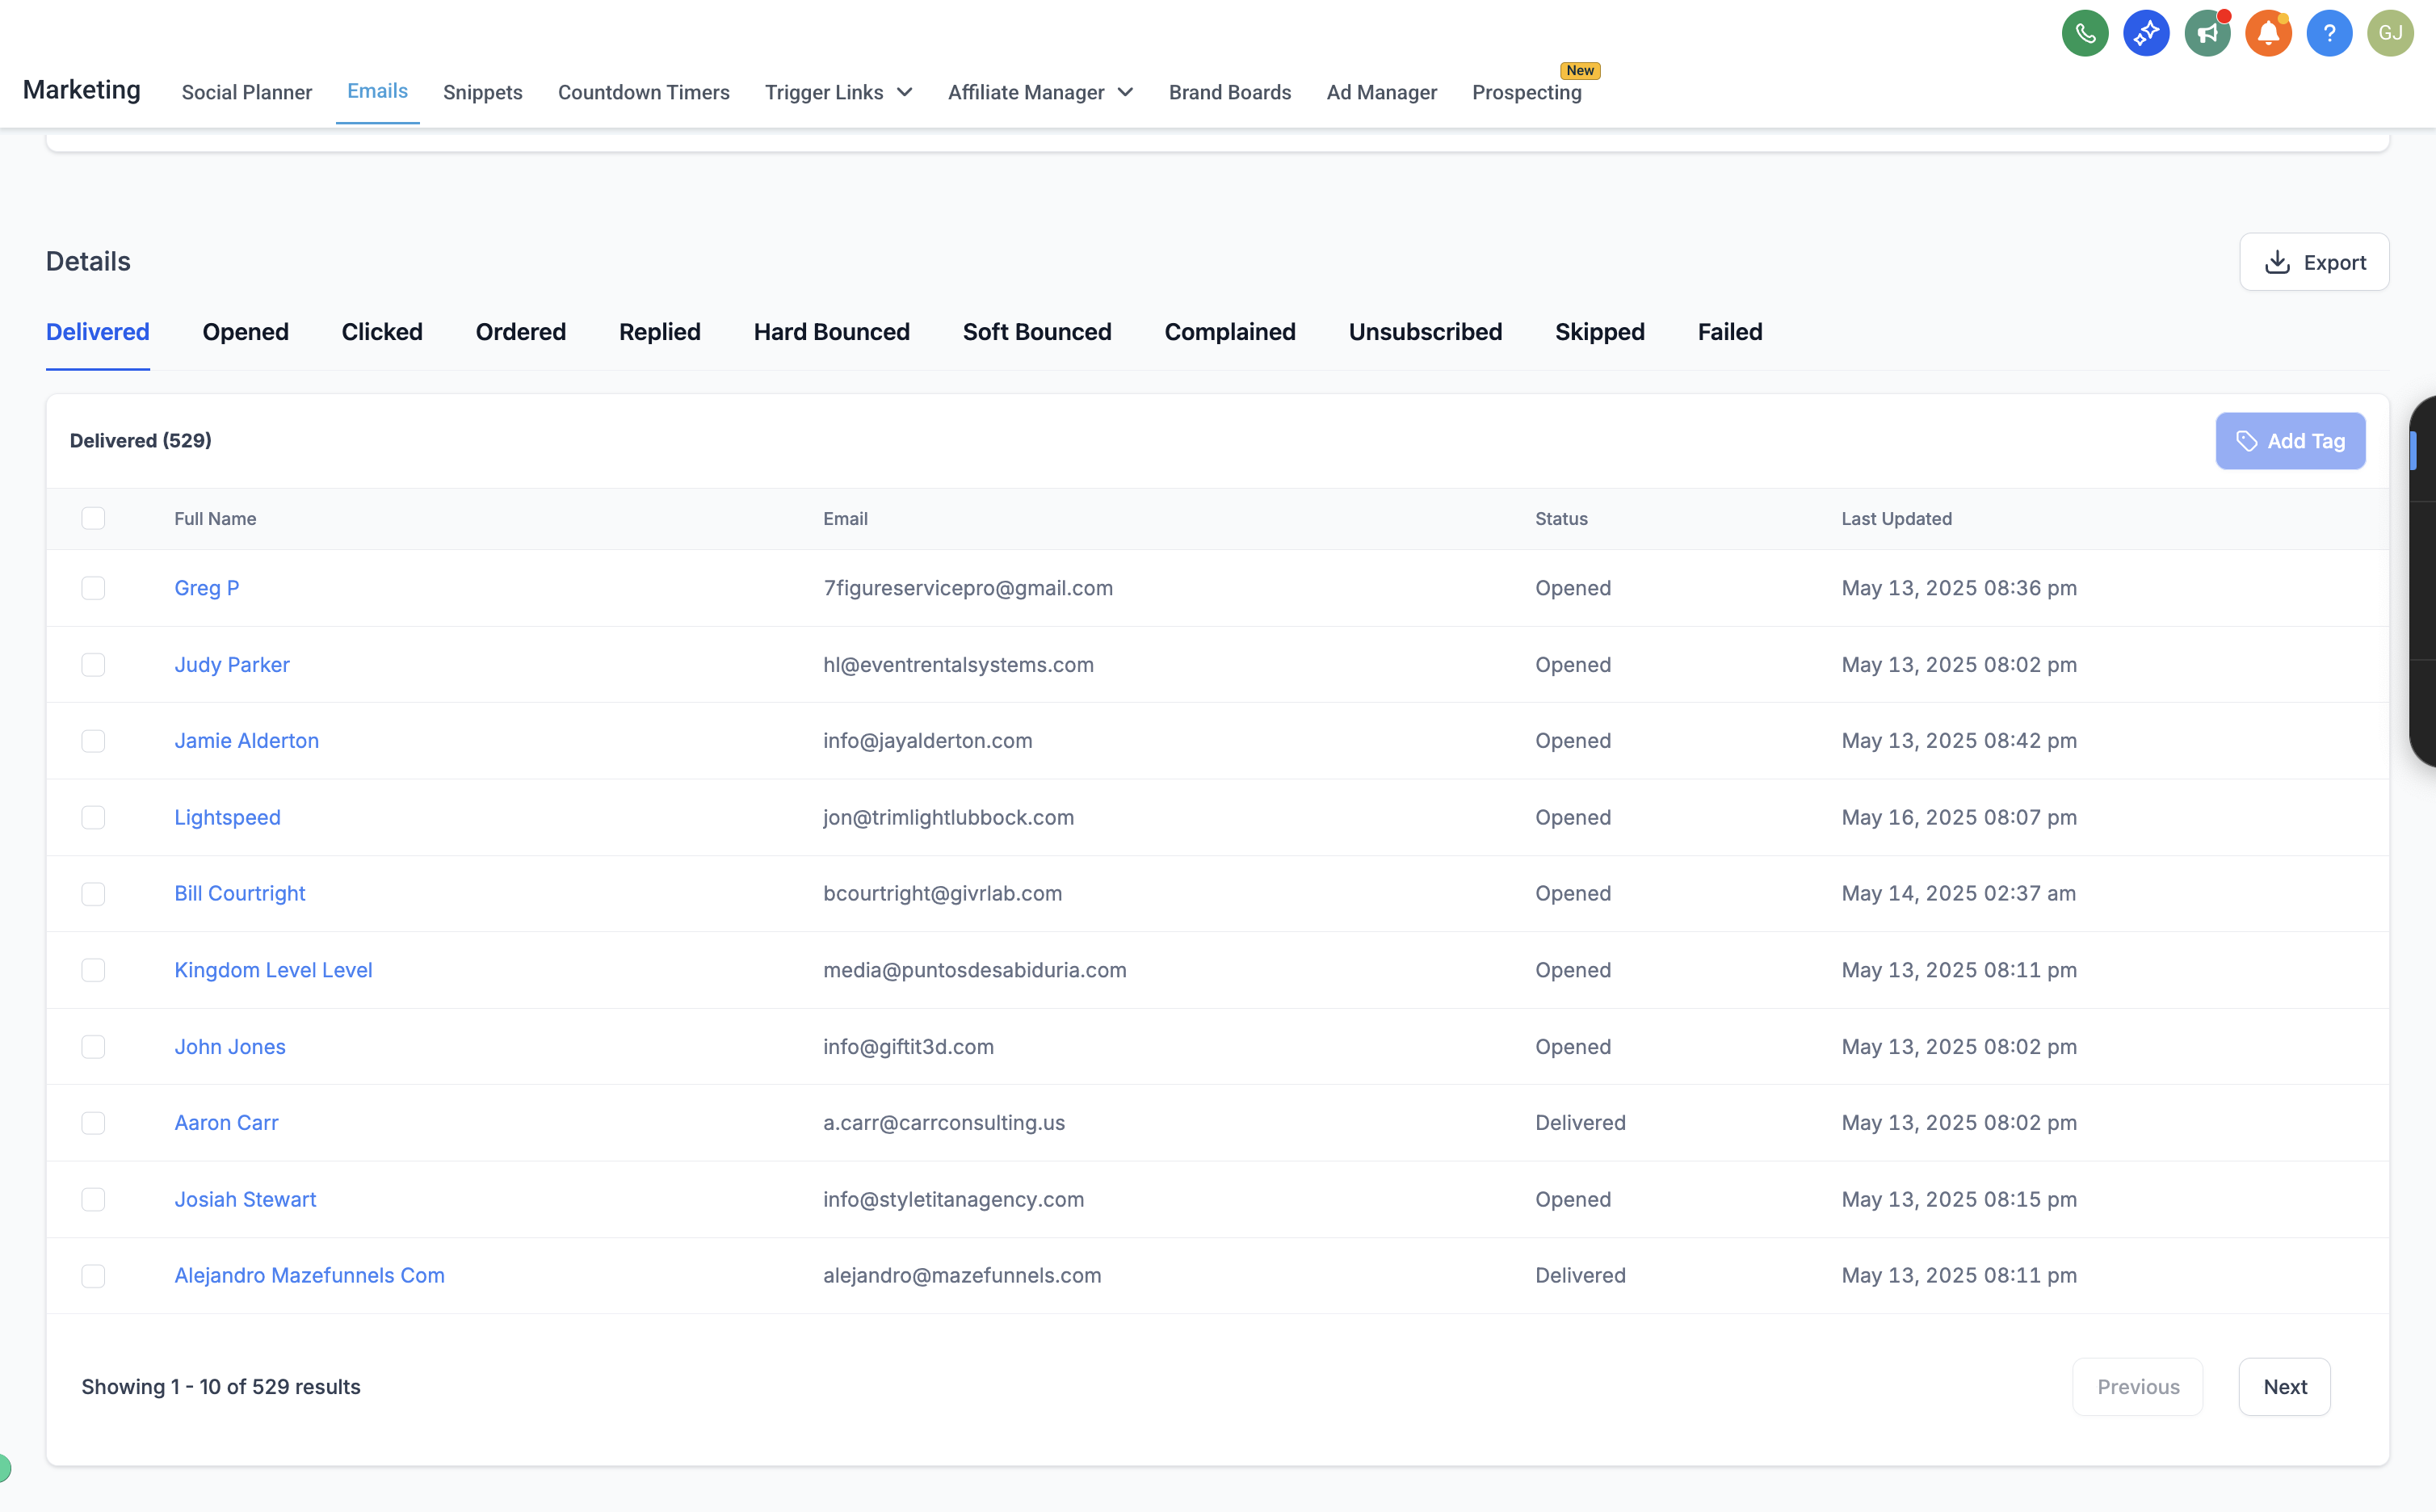
Details Tab Overview
The Details section lists individual contact-level engagement data with the following tabs:
Delivered: All recipients who successfully received the email.
Opened: Contacts who opened the email.
Clicked: Recipients who clicked at least one link.
Ordered: Contacts who made a purchase (if conversion tracking is enabled).
Replied: Recipients who responded directly to the email.
Hard Bounced / Soft Bounced: Contacts whose emails couldn’t be delivered.
Complained: Contacts who marked the email as spam.
Unsubscribed: Contacts who opted out.
Skipped: Contacts who weren’t sent the email due to filters or exclusions.
Failed: Emails that encountered sending errors.
Each column includes:
Full Name
Email Address
Status
Last Updated Timestamp
You can also Export the data as a CSV file for deeper analysis.
Frequently Asked Questions
Q: Why don’t I see any statistics for my campaign?
Make sure your email has been sent and delivered successfully. Drafts or scheduled campaigns won’t show data until they’re sent.
Q: Can I download or export these reports?
Yes, you can export data (like Delivered, Opened, Clicked, etc.) directly from the Details section as a CSV for deeper analysis or record-keeping.
Q: Can I see who specifically opened or clicked my email?
Yes. In the Details section, open the corresponding tab (Opened, Clicked, Unsubscribed, etc.) to view contact-level engagement.
Was this article helpful?
That’s Great!
Thank you for your feedback
Sorry! We couldn't be helpful
Thank you for your feedback
Feedback sent
We appreciate your effort and will try to fix the article