Super Agent Activity Feed
The Activity Feed for Super Agents provides a single timeline of everything your agent has done — both live chat conversations and automated trigger runs (form submissions, tag changes, and more). Click any run to open its execution log — the completed steps, skills and tools used, and final result — making it easy to monitor and debug your agents in one place.
This article explains what the Activity Feed is, how to use it to monitor and debug your Super Agents, and why visibility into agent execution matters for trust and performance.
What is the Super Agent Activity Feed?
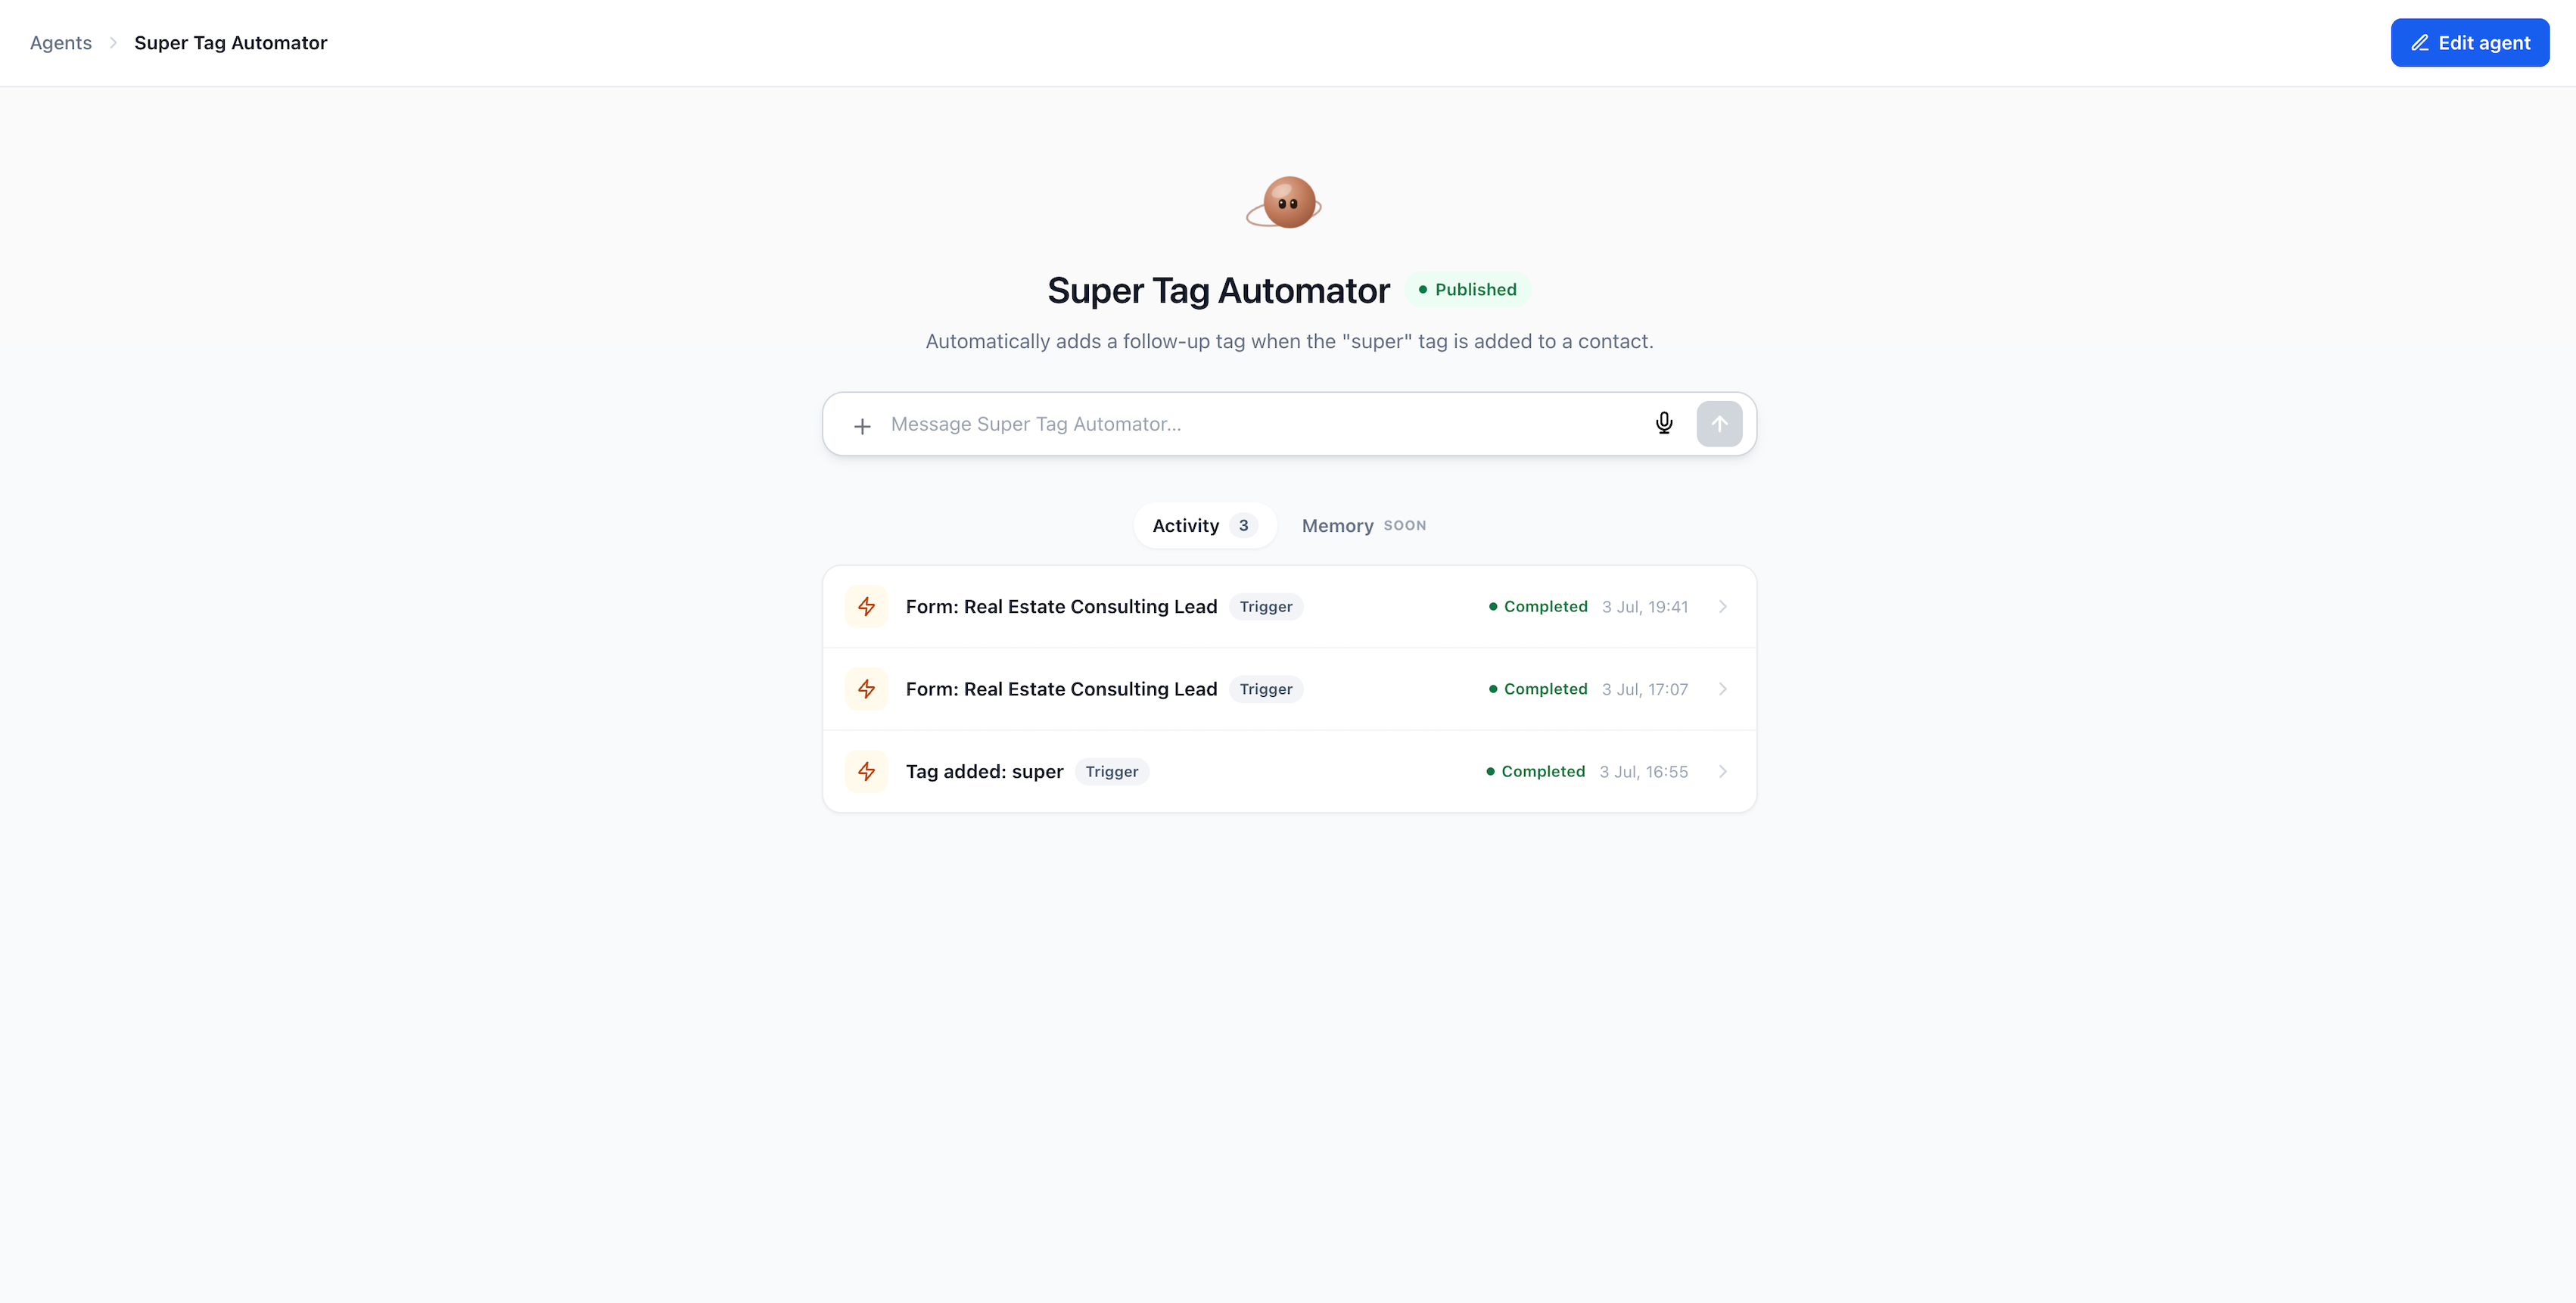
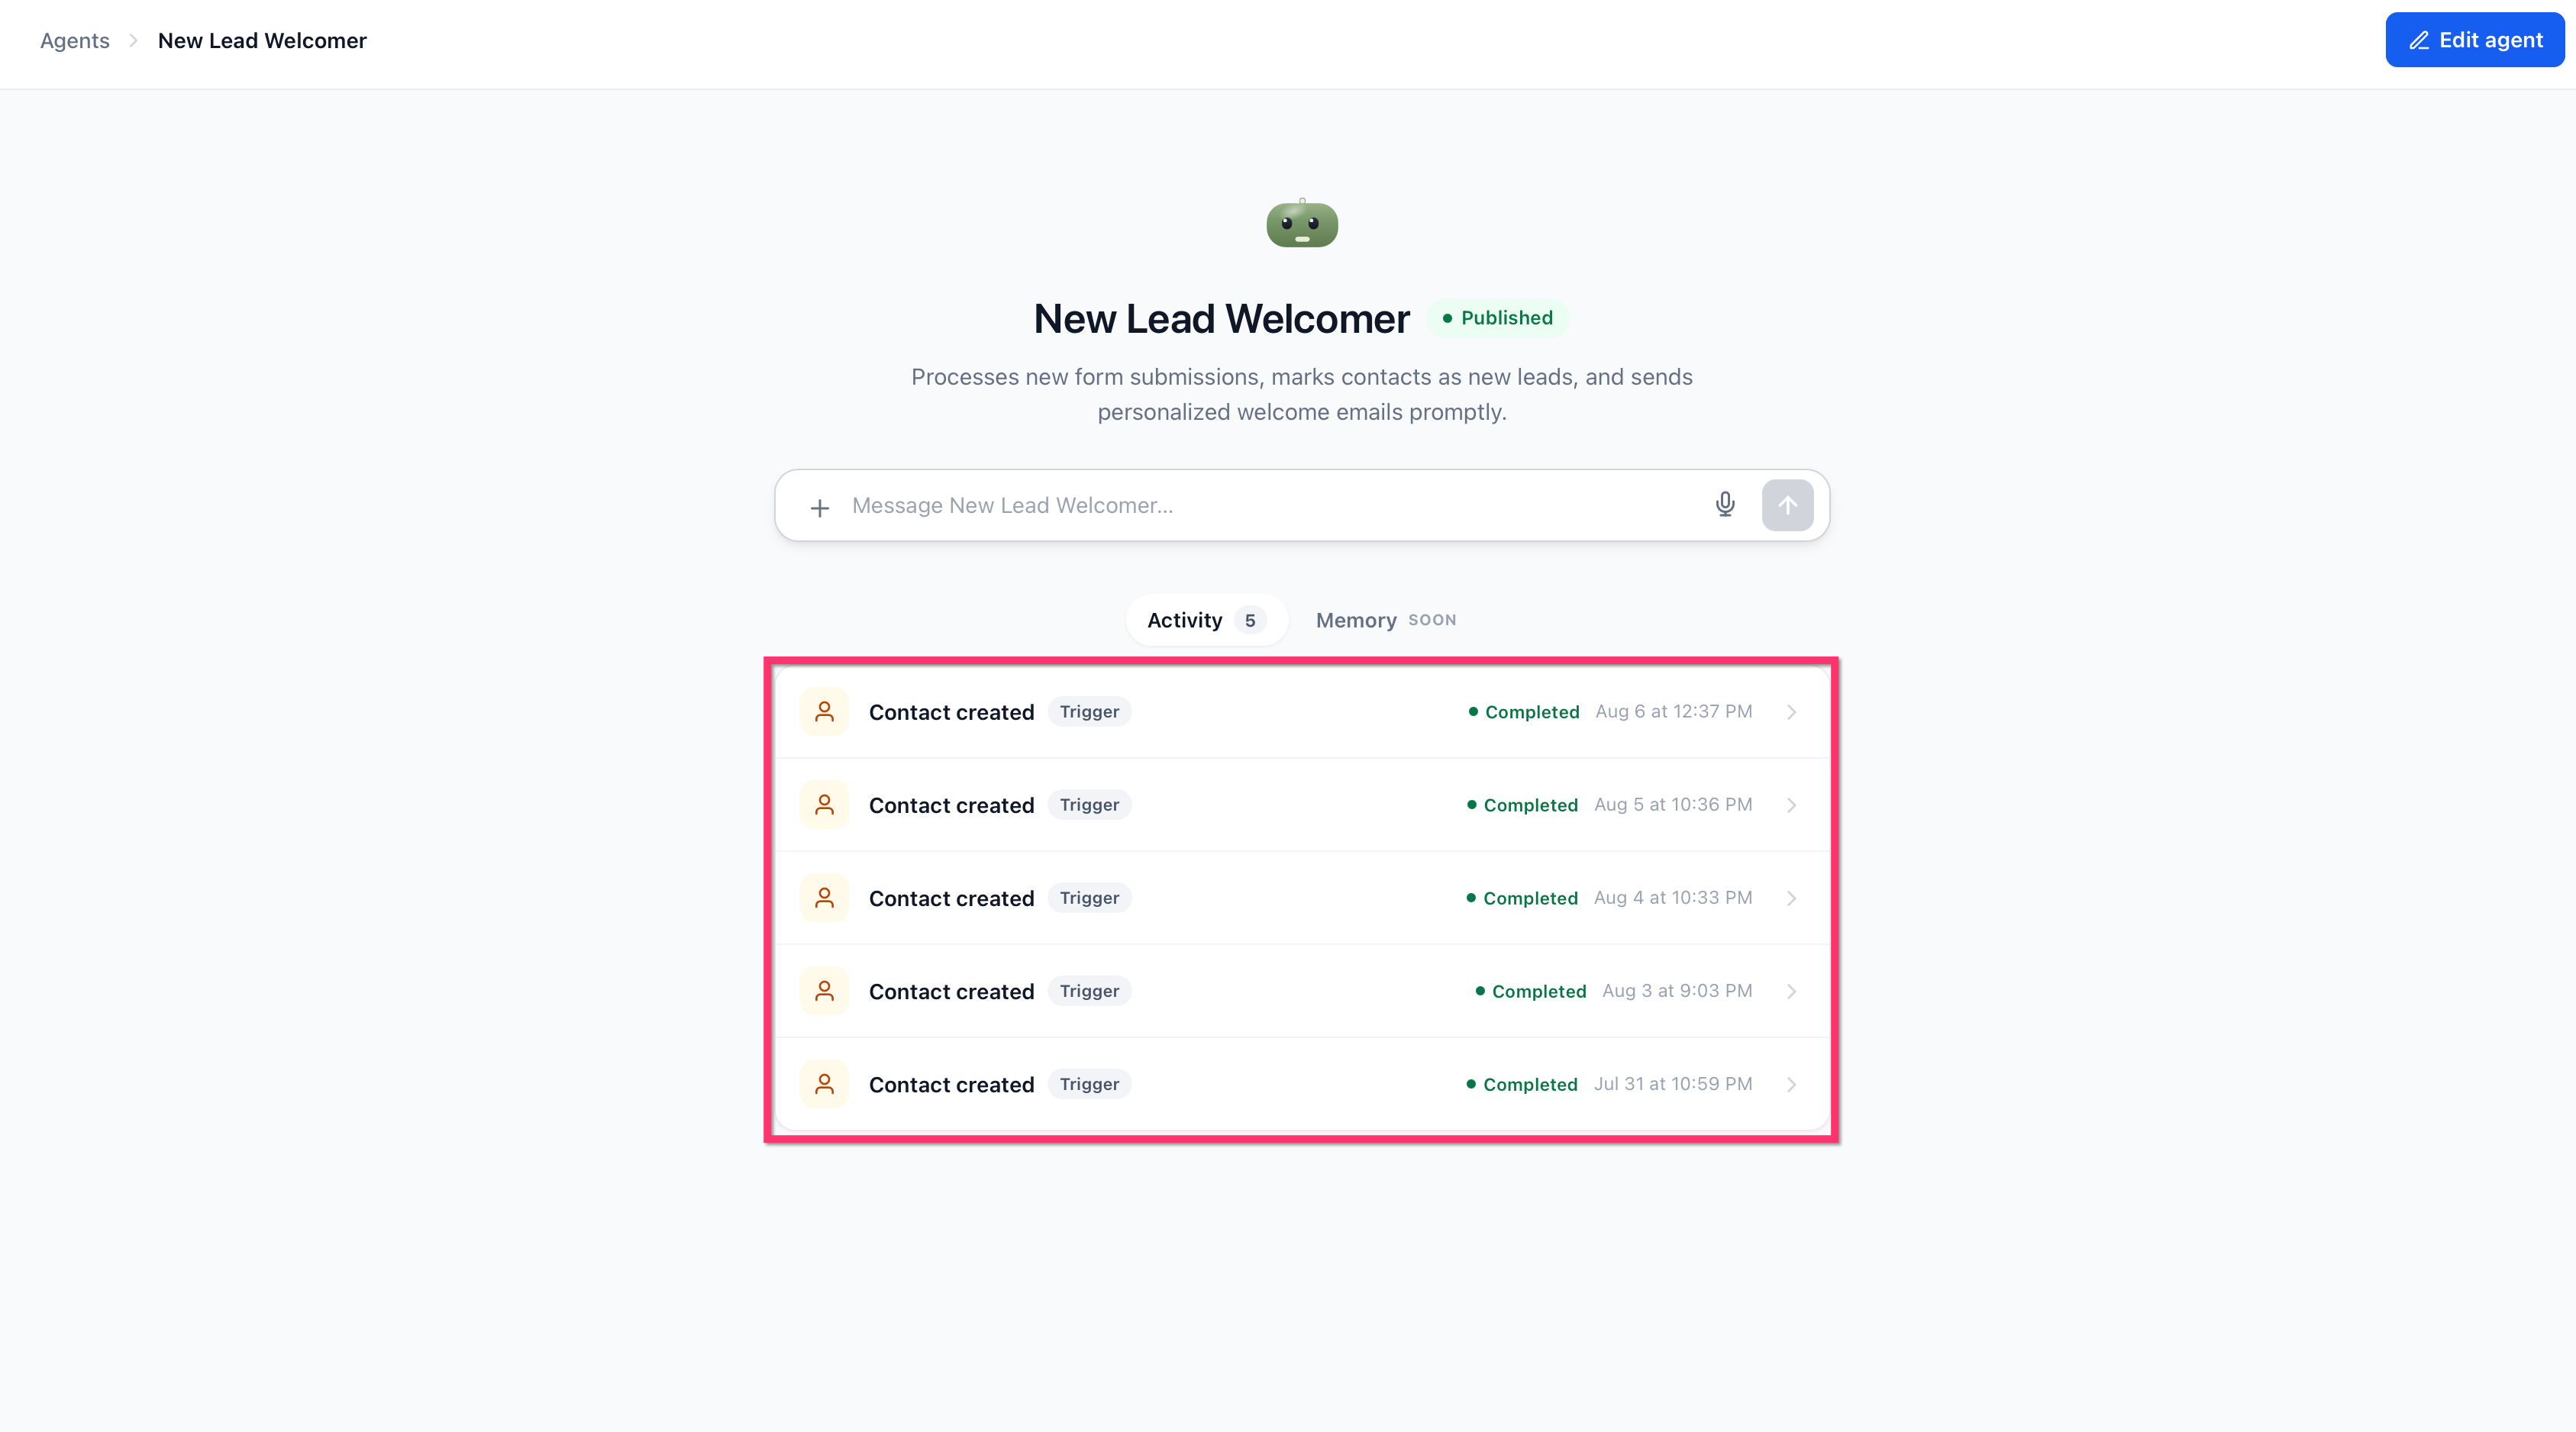
The Activity Feed is a unified timeline inside every Super Agent that displays recent Super Agent runs and activity, sorted in reverse chronological order (newest first). It combines live chat conversations and automated trigger executions — form submissions, tag changes, and other automations — into one view.
Each row in the feed shows an icon (lightning bolt for trigger runs, chat bubble for conversations), run status (such as "Completed"), timestamp, trigger type label (such as "Trigger" or "Chat"), and the context that fired the agent (such as "Form: Real Estate Consulting Lead" or "Tag added: new-lead"). Click any run to open its execution log, revealing the completed steps, which skills and tools were used, their inputs and outputs, and the final response delivered.
The Activity Feed is accessible inside Agent Studio under the Activity tab (which displays a badge count of recent runs) and is available on Super Agents that support this feature.
Key Benefits
The Activity Feed centralizes every action your Super Agent takes, giving you visibility and control over both live and automated interactions.
How to Use the Activity Feed
Follow these steps to monitor and debug your Super Agents using the Activity Feed.
Go to the AI Agents section in HighLevel and open Agent Studio. Select the Super Agent you want to monitor.
Click the Activity tab at the top of the agent's page. The tab displays a badge showing the number of recent runs. The feed displays runs in reverse chronological order, with each row showing an icon, status, timestamp, trigger type label, and context description.
Scroll through the feed to view every run — both live chat sessions and automated trigger executions. Each row shows the run's status, timestamp, trigger type, and context. Click any row to open the full execution log.
Click any run in the feed to open its execution log. The log displays the conversation title, action buttons (refresh, timing metrics, token usage, "Copy ID", and "View in Agent Logs"), the agent conversation view on the left (showing the run summary and completed steps), and the execution timeline on the right (showing each step with timing and token data).
Use the Activity Feed during testing to verify that your agent's skills and triggers work as expected. During troubleshooting, review the execution timeline to identify which step caused an issue. Timing and token metrics help you optimize performance and identify bottlenecks.
Understanding Activity Feed Data
Each row in the Activity Feed provides key information about a single agent run. Understanding these data points helps you quickly assess performance and identify issues.
Each run displays an icon: a lightning bolt for automated trigger runs or a chat bubble for live chat conversations. This helps you instantly distinguish between user-driven chat sessions and automated executions.
The status indicator shows whether the run completed successfully (such as "Completed"), failed, or is still in progress. Use this to quickly spot errors or incomplete executions without opening the full log.
Each run displays the date and time it started, making it easy to correlate agent activity with external events, user actions, or specific automation triggers.
The trigger type badge shows whether the run was initiated by a "Trigger" (automation) or "Chat" (live conversation). This label appears next to the context description, helping you distinguish between user-driven and automated interactions.
For automated trigger runs, the context field displays the name of the form, tag event, or other automation that fired the agent. For chat runs, it displays a preview of the user's message. This allows you to trace runs back to their source without opening the full log.
Viewing Execution Logs
Clicking any run in the Activity Feed opens the execution log, which provides visibility into the agent's completed steps, tool usage, timing, and results. The execution log is divided into two main sections displayed side by side.
The left side of the execution log displays the agent conversation view, which shows the run summary and final response. This section displays the agent's avatar icon, thinking status (such as "Thought for 2s"), and the completion message.
Below the thinking status, you'll see a structured execution summary with a title, trigger details, timestamp, and detailed step breakdowns. Each step includes tables showing fields and values, making it easy to verify the agent's data lookups, eligibility checks, and action results.
The right side of the execution log displays the execution timeline, which shows every step the agent took during the run in sequential order. Each step includes an icon, step label (such as "Message" or "Llm"), description, timing metrics, and token usage.
Each step can be expanded to reveal detailed execution data, including inputs, outputs, structured data, and nested sub-steps for complex tool or skill invocations. The timeline provides transparency into the agent's execution process, making it easy to debug failures, verify correct behavior, and optimize performance.
The top of the execution log displays the conversation title along with action buttons: a refresh icon to reload the log, total execution time, total token usage, a "Copy ID" button to copy the conversation ID for reference or support tickets, and a "View in Agent Logs" button that opens the full log in a separate view. Use these controls to monitor performance, share run details with your team, or escalate issues to support.
Frequently Asked Questions
Was this article helpful?
That’s Great!
Thank you for your feedback
Sorry! We couldn't be helpful
Thank you for your feedback
Feedback sent
We appreciate your effort and will try to fix the article