The Dashboard gives you one place to monitor revenue, recurring revenue, customers, SaaS performance, and reselling profitability. Use Summary for an overall business snapshot, SaaS for subscription performance, and Reselling to understand revenue, costs, profit, and margins.
TABLE OF CONTENTS
What Is the Dashboard?
The Dashboard brings key customer and financial metrics together so you can quickly understand business performance without reviewing individual accounts or transactions.
It includes three main views:
- Summary: Overall revenue, MRR, customers, growth, and revenue distribution.
- SaaS: Subscription MRR, customer trends, and recurring revenue changes.
- Reselling: Revenue, cost, profit, and margins from resold products.
Summary
The Summary view provides a high-level snapshot of overall business performance. Use it to quickly compare revenue, recurring revenue, customer growth, and revenue sources.
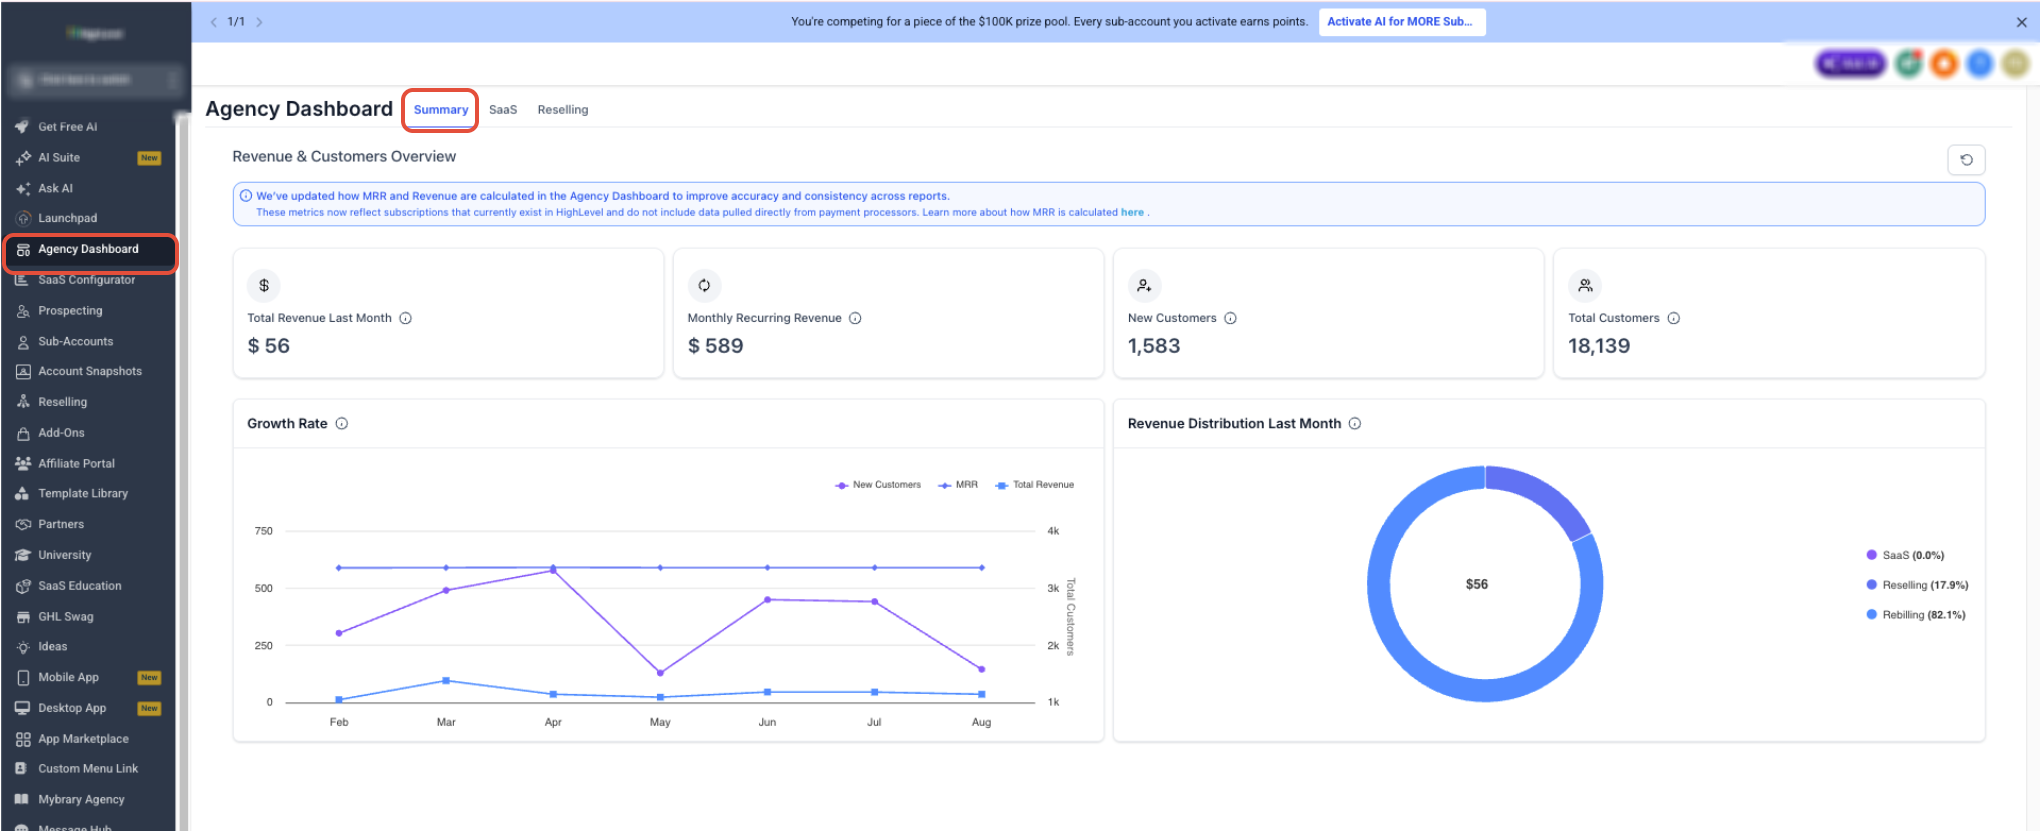
Select Summary to review your primary revenue and customer metrics, along with growth and revenue distribution.
Key Metrics
- Total Revenue Last Month: Qualifying revenue generated during the previous month.
- Monthly Recurring Revenue (MRR): Monthly value of qualifying recurring subscriptions.
- New Customers: Customers added during the reported month.
- Total Customers: Overall customer count represented in the Dashboard.
The Growth Rate chart shows how customer count, MRR, and revenue change over time.
Revenue Distribution Last Month shows how the previous month’s revenue is divided across the available revenue sources.
Important:New Customers and Total Customers are customer-count metrics and are separate from Revenue and MRR calculations.
SaaS
The SaaS view provides a deeper look at recurring subscription performance. Use it to understand current MRR and identify what is causing recurring revenue to increase or decrease.
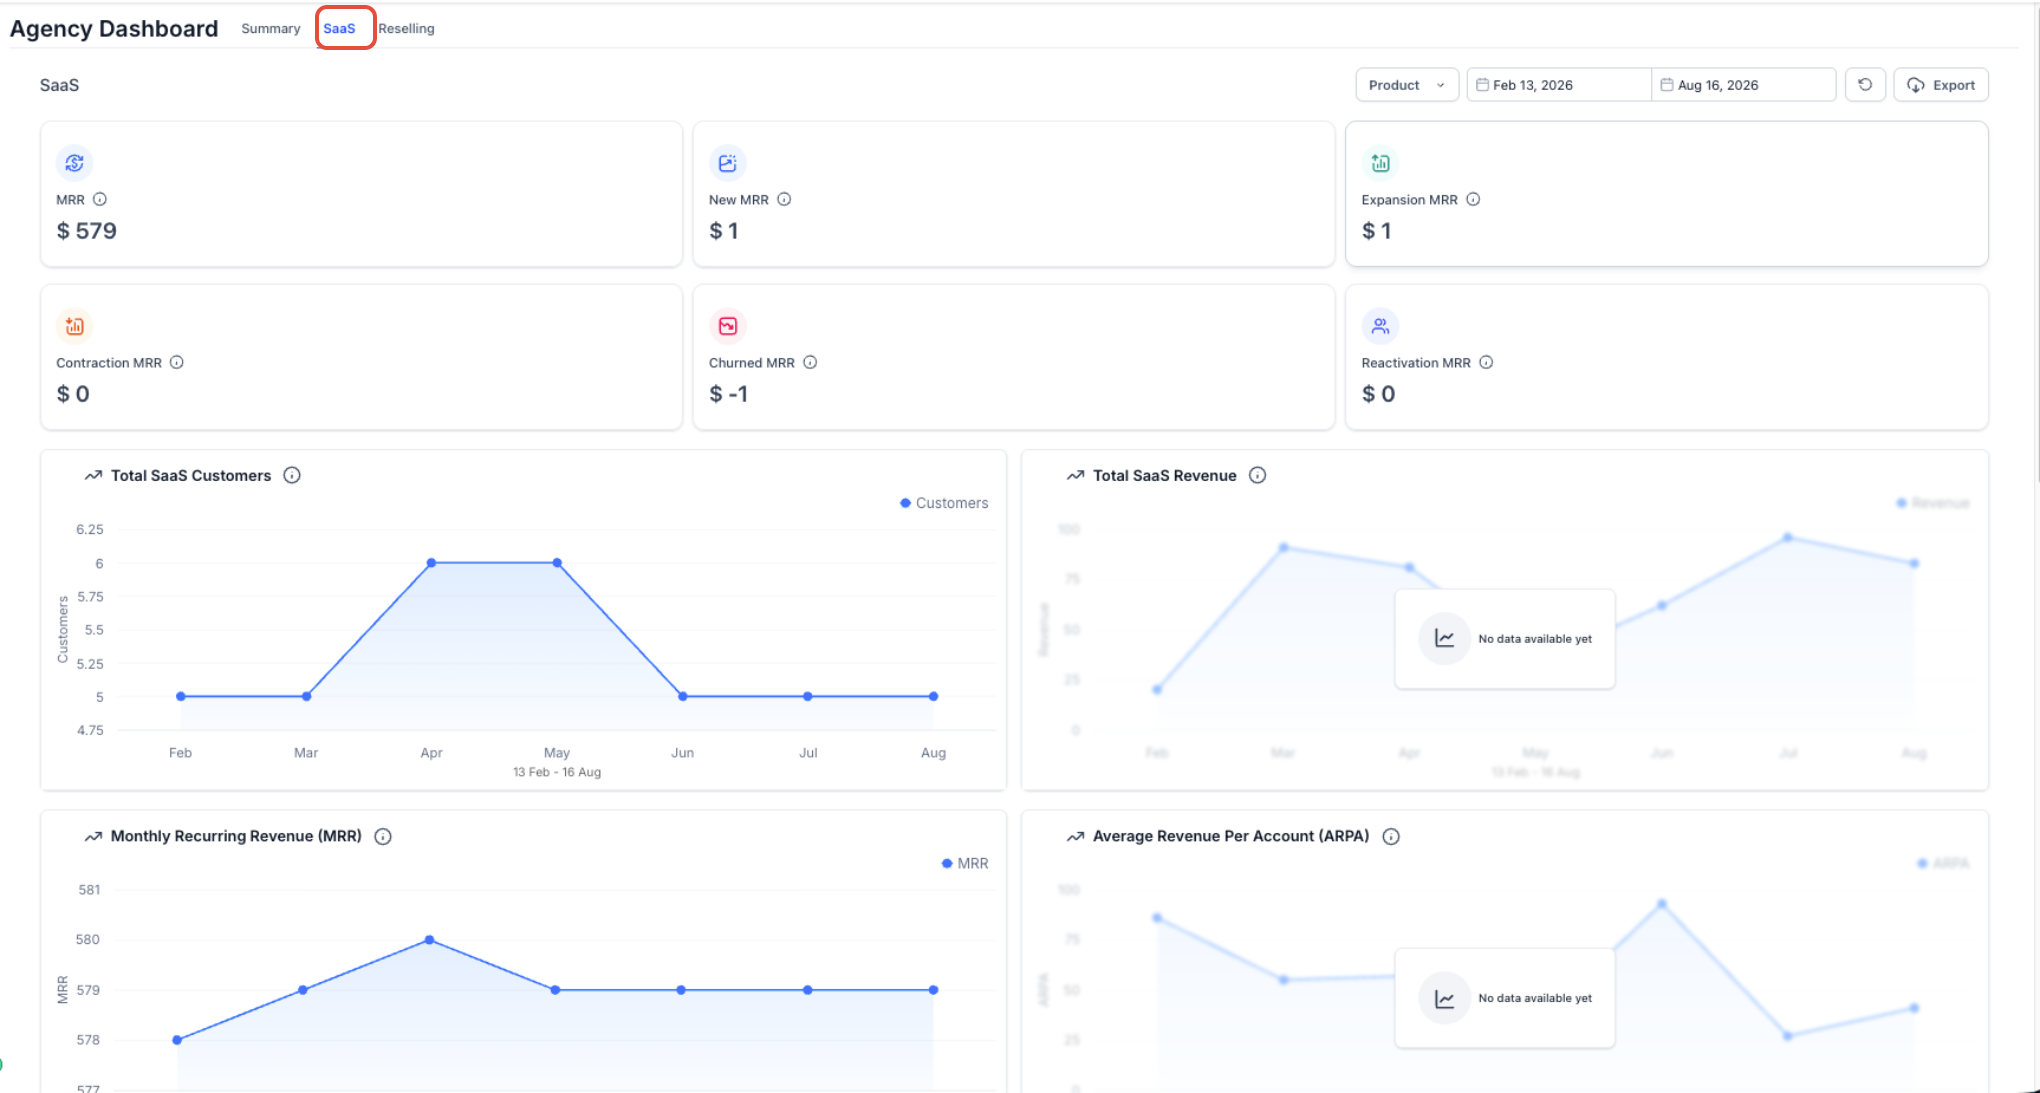
Select SaaS to review MRR changes, customer trends, recurring revenue, and historical subscription performance.
MRR Metrics
- MRR: Total monthly recurring revenue from qualifying SaaS subscriptions.
- New MRR: Recurring revenue added from new paid subscriptions.
- Expansion MRR: Additional recurring revenue from existing subscriptions that increase in value.
- Contraction MRR: Recurring revenue lost when active subscriptions decrease in value.
- Churned MRR: Recurring revenue lost from canceled or lapsed subscriptions.
- Reactivation MRR: Recurring revenue restored when qualifying inactive subscriptions return to paid status.
Trend Charts
The SaaS view also includes:
- Total SaaS Customers: Customer count over time.
- Total SaaS Revenue: SaaS revenue over the selected period.
- Monthly Recurring Revenue (MRR): Recurring subscription value over time.
- Average Revenue Per Account (ARPA): Average recurring revenue per qualifying SaaS customer account.
Note: MRR is based on qualifying subscriptions represented within the system. Subscriptions created independently
outside the system may not be included.
Reselling
The Reselling view shows how resold products contribute to revenue and profitability. Use it to compare what customers were charged against the cost of providing those products.
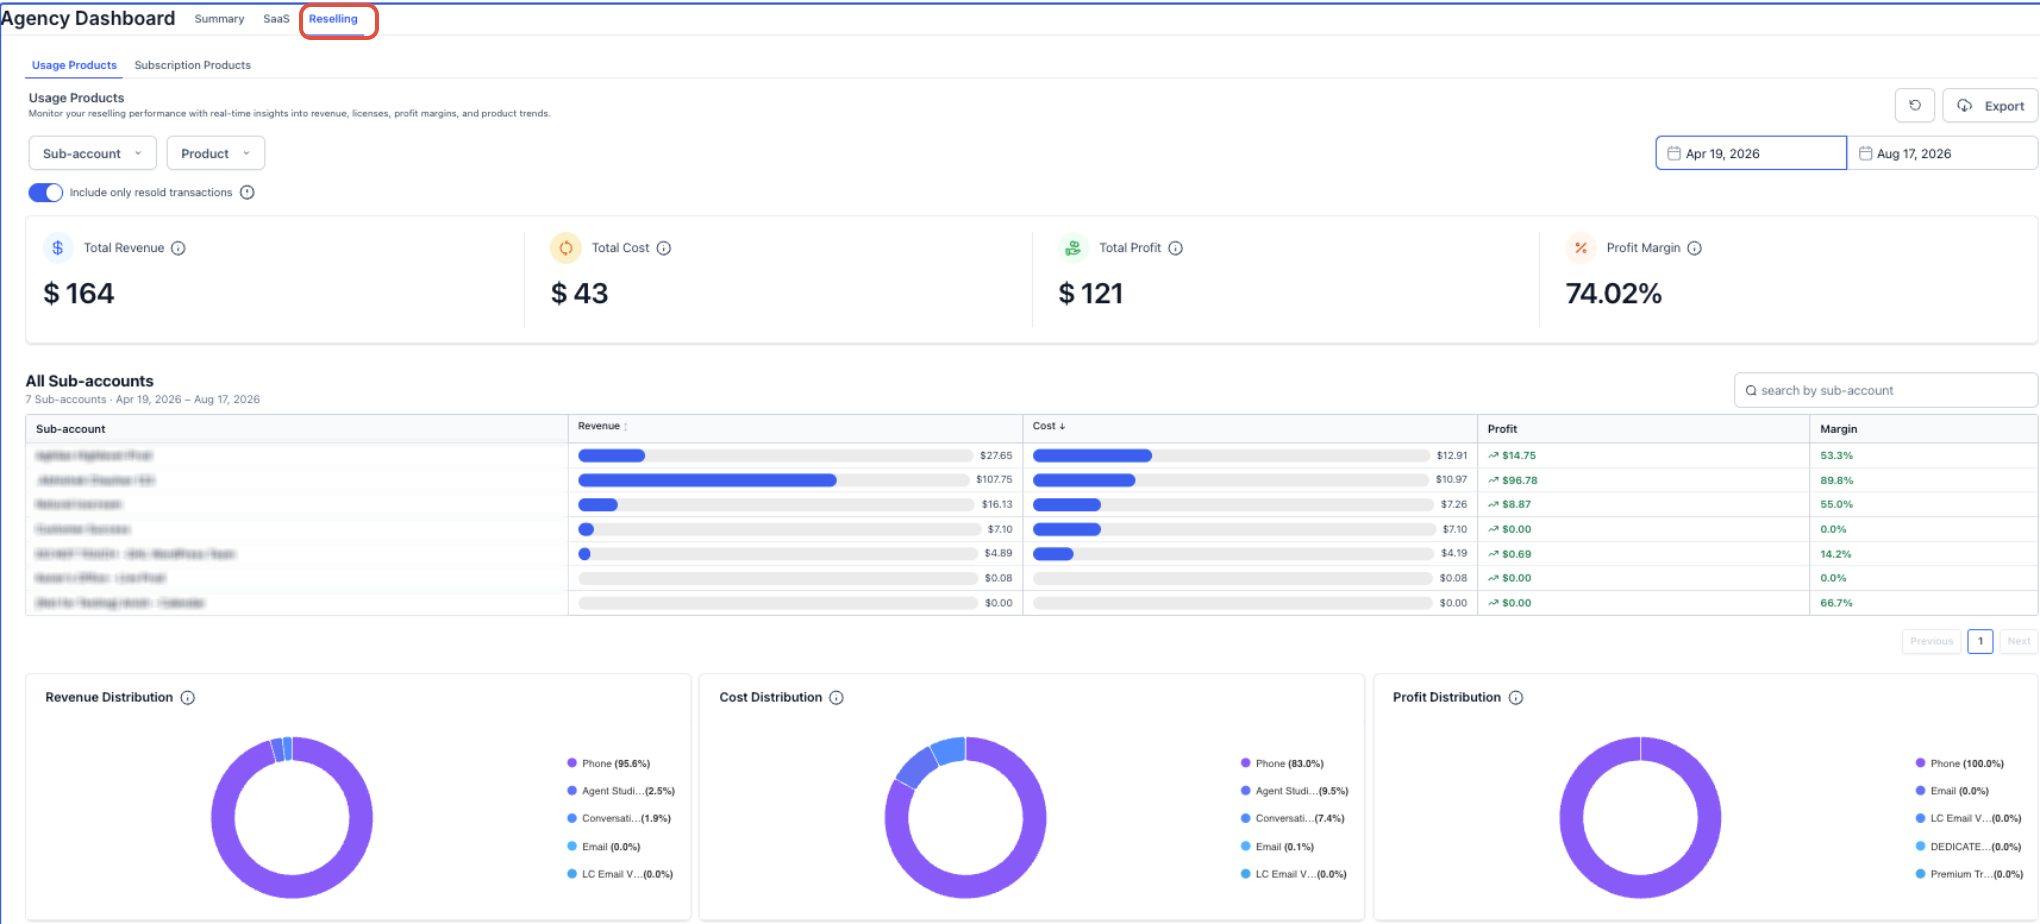
Select Reselling to review revenue, cost, profit, margin, account performance, and product distribution. Confirm your filters before comparing results.
Key Metrics
- Revenue: Amount generated from qualifying reselling activity.
- Cost: Cost incurred for that activity.
- Profit: Revenue remaining after Cost is deducted.
- Profit Margin: Profit expressed as a percentage of Revenue.
Profit = Revenue − Cost
Usage and Subscription Products
Usage Products are charged based on consumption or activity.
Subscription Products are resold products billed on a recurring basis.
Keeping these views separate makes it easier to compare usage-based profitability with recurring subscription performance.
Filters and Reporting
Use the available filters to narrow the report by:
- Account
- Product
- Date Range
- Resold transactions
The account table compares Revenue, Cost, Profit, and Margin across customers, while the distribution charts show which products contribute the most Revenue, Cost, and Profit.
You can also Refresh the report or Export the available data for additional analysis.
Frequently Asked Questions
Q: Why does Revenue or MRR differ from another report?
Reports can use different data sources, qualification rules, filters, or reporting periods. Confirm that you are comparing the same data and date range.
Q: What is the difference between New Customers and Total Customers?
New Customers represents customers added during the reported month. Total Customers represents the overall customer count shown in the Dashboard.
Q: Why can MRR differ between Summary and SaaS?
Summary provides an overall recurring revenue view, while SaaS focuses specifically on qualifying SaaS subscription activity and MRR changes.
Q: Are subscriptions created outside the system included in MRR?
Not necessarily. MRR is based on qualifying subscriptions represented within the reporting system. Independently created subscriptions may not be included.
Q: Why do Reselling totals change when I apply filters?
Revenue, Cost, Profit, and Margin are calculated from the transactions included by your selected account, product, date range, and transaction filters.
Q: What is the difference between Usage Products and Subscription Products?
Usage Products are charged according to consumption or activity. Subscription Products are recurring resold products.
Need Help?
If a Dashboard value does not look correct, first confirm the selected tab, date range, account, product, and transaction filters.
Also verify that the subscriptions or transactions you expect to see qualify for the selected report.
If the difference remains, capture the affected metric, reporting period, selected filters, and expected value before contacting support. This information will make the issue easier to investigate.
Was this article helpful?
That’s Great!
Thank you for your feedback
Sorry! We couldn't be helpful
Thank you for your feedback
Feedback sent
We appreciate your effort and will try to fix the article