The Agency Dashboard gives you a high-level view of your agency's revenue, recurring revenue, customers, SaaS performance, and reselling profitability. Use the Summary tab for an overall business snapshot, the SaaS tab for subscription performance, and the Reselling tab to analyze revenue, costs, and profit from resold products.
This guide explains what the main dashboard metrics mean, which time period they represent, and where the reported data comes from.
TABLE OF CONTENTS
- What Is the Agency Dashboard?
- Key Benefits of the Agency Dashboard
- How to Access the Agency Dashboard
- Frequently Asked Questions
- Related Articles
What Is the Agency Dashboard?
The Agency Dashboard centralizes key business metrics so agency users can monitor revenue, customers, recurring subscriptions, and reselling performance without reviewing each sub-account separately.
The dashboard contains three primary reporting views:
- Summary: Overall agency revenue, MRR, customer counts, and revenue distribution.
- SaaS: SaaS subscription growth, MRR movement, customer trends, and recurring revenue performance.
- Reselling: Revenue, cost, profit, margin, and product performance for resold services.
Key Benefits of the Agency Dashboard
Reviewing the dashboard regularly helps you understand where agency revenue comes from and which parts of your SaaS and reselling business are growing or need attention.
- Centralized Performance: Review major agency metrics from one reporting area.
- Recurring Revenue Visibility: Track MRR and changes to your SaaS subscription base.
- Customer Growth Tracking: Compare newly added customers with your overall customer base.
- Reselling Profitability: Compare revenue, cost, profit, and margin across products and sub-accounts.
- Revenue Source Clarity: Understand how SaaS, Reselling, and Rebilling contribute to agency revenue.
Summary Tab
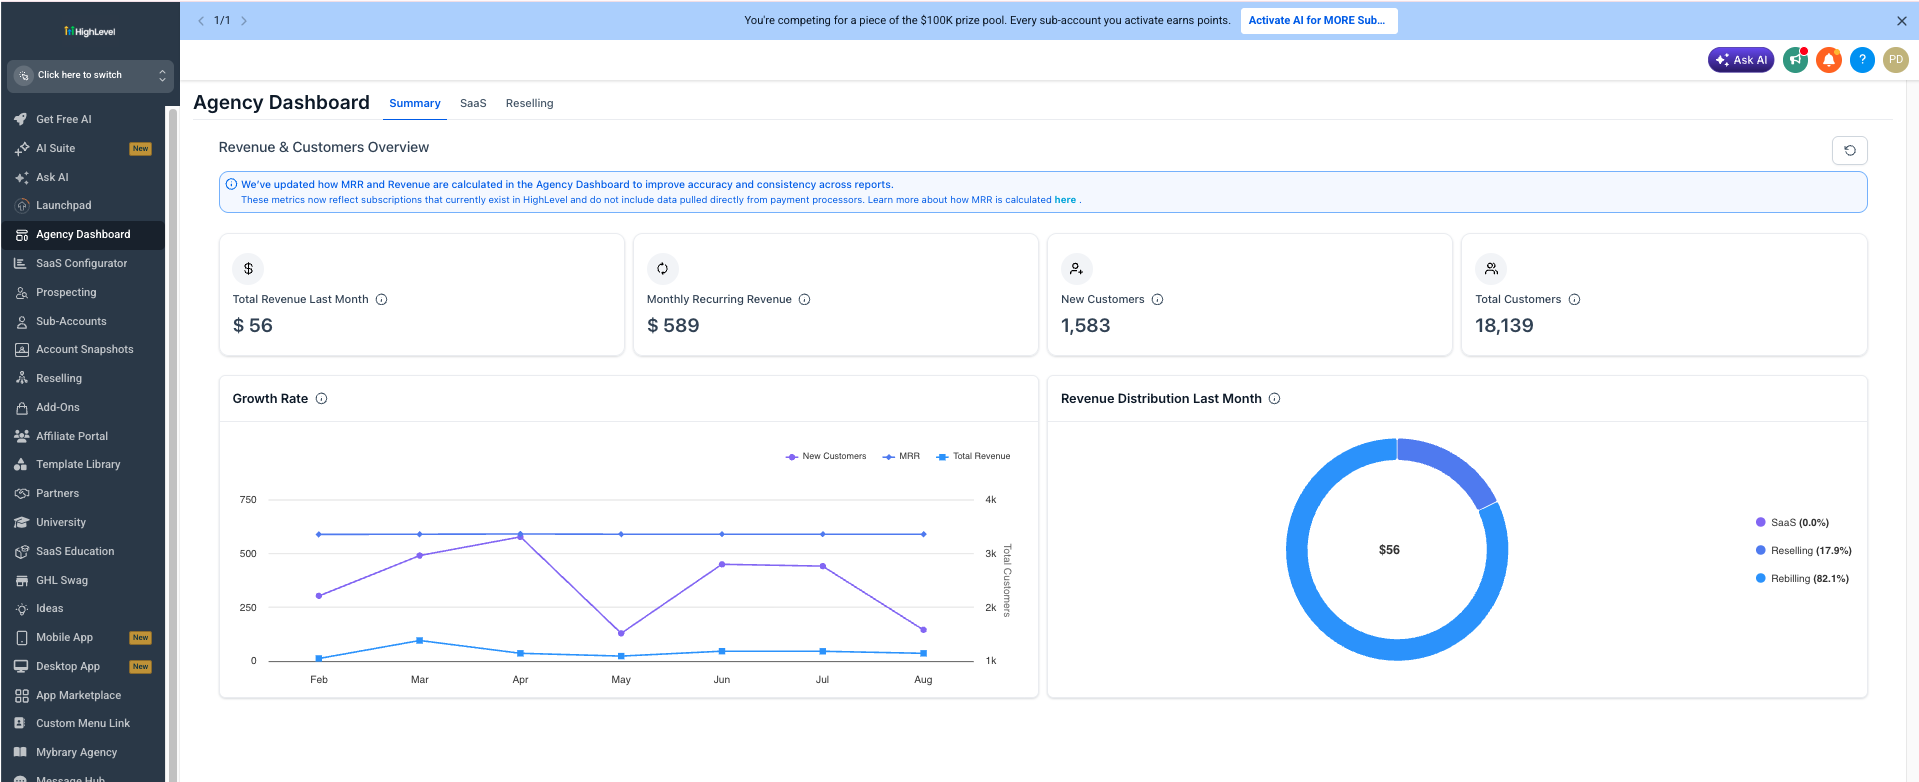
The Summary tab provides the fastest view of overall agency performance. Revenue reporting uses qualifying revenue generated within HighLevel, helping keep the headline metrics consistent with the underlying HighLevel reporting data.
Summary KPI Cards
The four KPI cards answer different questions about your agency's financial and customer performance.
- Total Revenue Last Month: Revenue generated during the previous month from qualifying HighLevel-backed sources, including SaaS, Reselling, and Rebilling.
- Monthly Recurring Revenue (MRR): The normalized monthly value of recurring subscriptions created and managed within HighLevel. The Summary view combines recurring revenue across supported HighLevel subscription sources. Subscriptions created outside HighLevel are not included.
- New Customers: The number of new customers added during the reported month. This is a customer-count metric and is separate from Revenue and MRR calculations.
- Total Customers: The overall customer count represented in the Agency Dashboard. Unlike New Customers, this is the total customer base rather than customers added during one month.
Growth Rate
The Growth Rate chart shows how key agency metrics change month over month. Use it to compare customer growth with MRR and revenue trends instead of relying only on the current KPI values.
Revenue Distribution Last Month
Revenue Distribution shows which HighLevel revenue streams contributed to the previous month's total revenue.
- SaaS: Revenue generated from SaaS subscriptions.
- Reselling: Revenue generated from resold HighLevel products and subscriptions.
- Rebilling: Revenue generated when supported usage costs are passed on to clients.
SaaS Tab
The SaaS tab provides a deeper view of recurring subscription performance. Use it when you need to understand why MRR increased or decreased, how your SaaS customer base is changing, or how recurring revenue is trending over time.
SaaS MRR Metrics
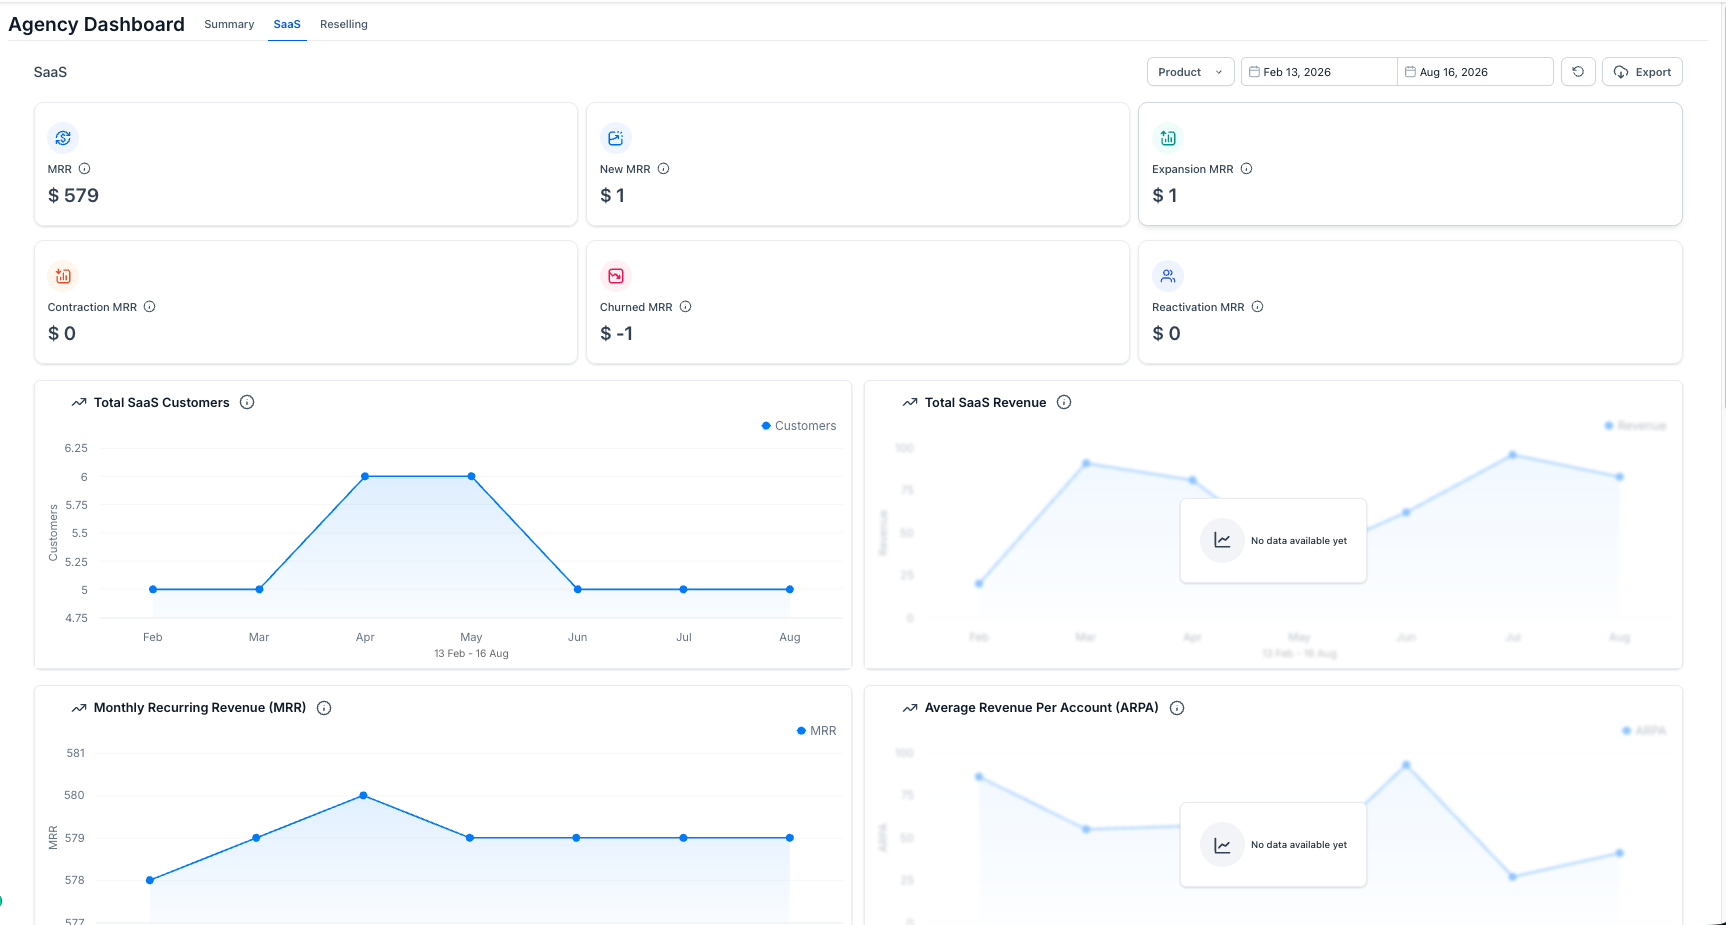
MRR components separate recurring revenue changes by the subscription event that caused them. This makes it easier to distinguish new growth from upgrades, downgrades, cancellations, and returning customers.
- MRR: Total monthly recurring revenue from qualifying SaaS subscriptions.
- New MRR: Recurring revenue added when a customer starts a new paid subscription or converts from a trial to paid.
- Expansion MRR: Additional recurring revenue created when an existing subscription increases in value, such as an upgrade.
- Contraction MRR: Recurring revenue lost when an active subscription decreases in value, such as a downgrade.
- Churned MRR: Recurring revenue lost when a subscription cancels or fully lapses.
- Reactivation MRR: Recurring revenue restored when a previously canceled or paused subscription returns to paid status.
SaaS Trend Charts
The charts below the MRR cards provide historical context for customer and recurring revenue performance over the selected reporting period.
- Total SaaS Customers: Shows how the SaaS customer count changes over time.
- Total SaaS Revenue: Shows SaaS revenue performance across the reporting period.
- Monthly Recurring Revenue (MRR): Shows the recurring monthly value of qualifying SaaS subscriptions over time.
- Average Revenue Per Account (ARPA): Shows the average recurring revenue generated per qualifying SaaS customer account.
Reselling Tab
The Reselling tab shows how resold products contribute to agency revenue and profitability. Use it to compare what clients were charged with the underlying cost of delivering those products.
Usage Products and Subscription Products
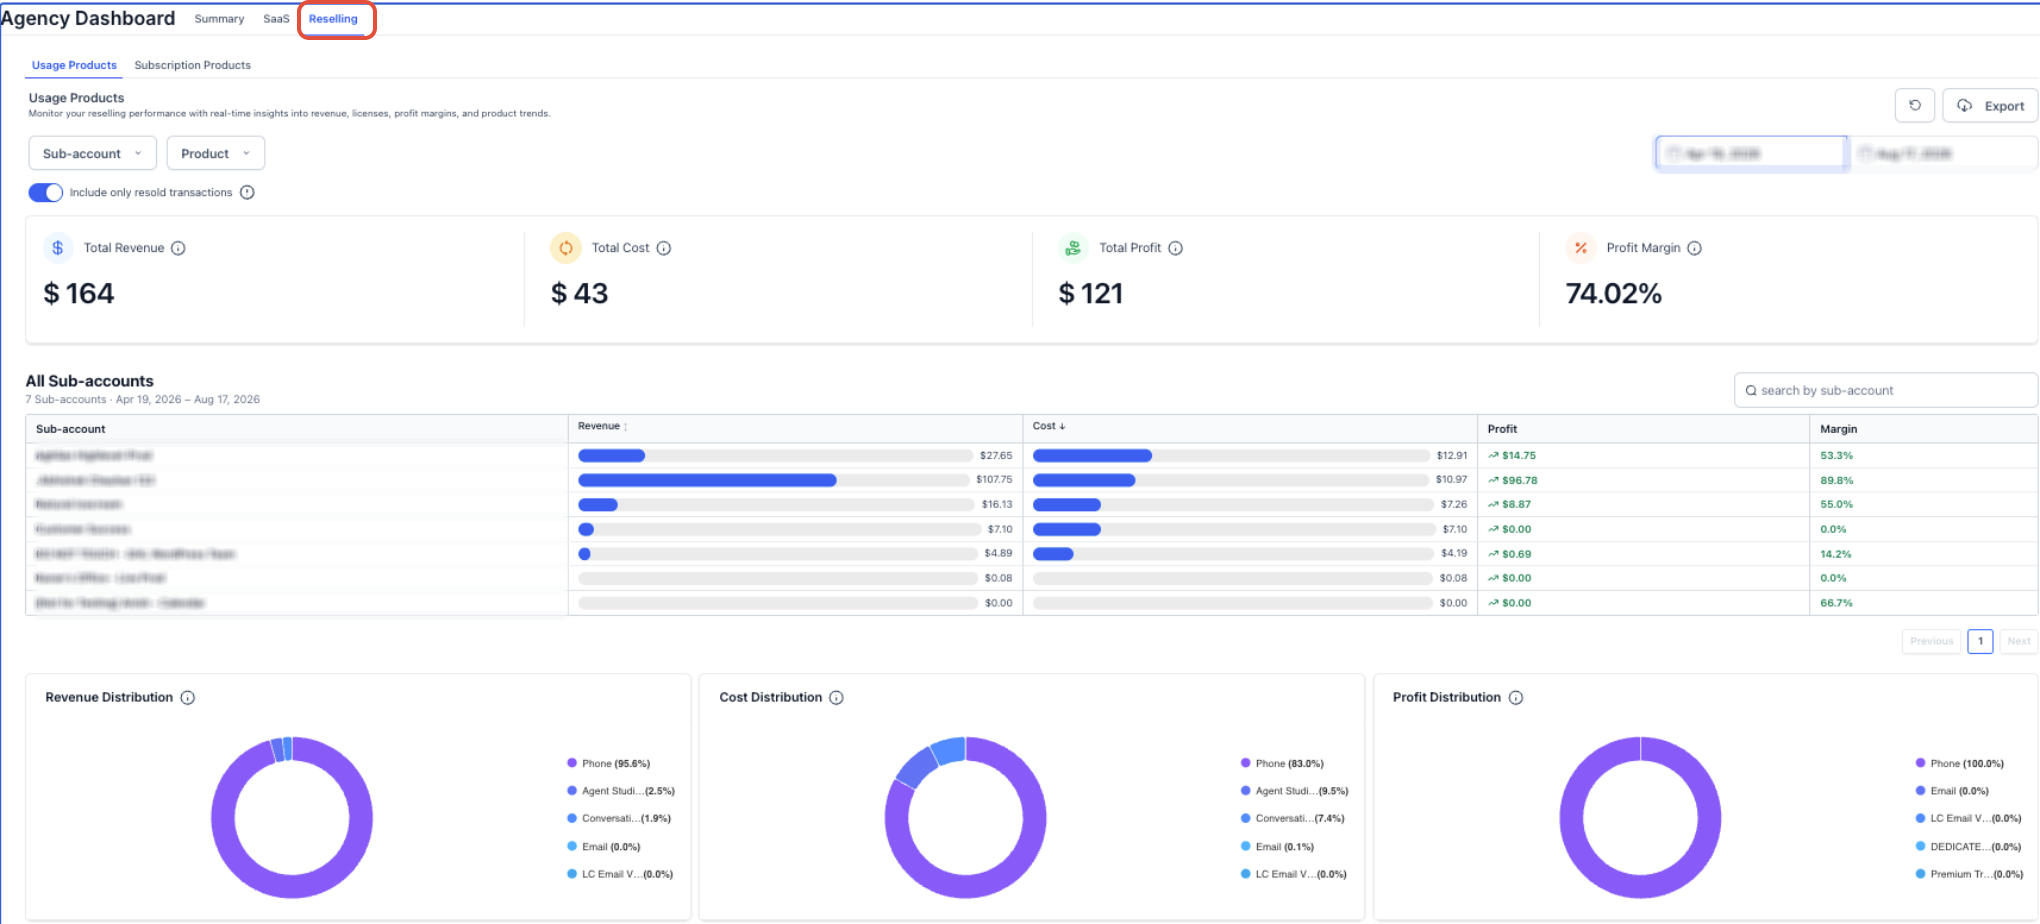
Reselling reporting separates products by how customers are charged so usage-based activity can be analyzed independently from recurring subscriptions.
- Usage Products: Products where charges are based on consumption or activity, such as supported phone, email, AI, and other usage-based services.
- Subscription Products: Resold products billed as recurring subscriptions.
Reselling Financial Metrics
The financial cards and sub-account table show whether resold activity is generating healthy margins for the selected reporting period.
- Revenue: Amount generated from reselling activity for the selected period.
- Cost: Cost incurred by the agency for that activity.
- Profit: Revenue minus Cost.
- Profit Margin: Profit expressed as a percentage of Revenue.
Profit = Revenue − Cost
Sub-Account Performance
The sub-account table helps identify which client accounts generate the most revenue, cost, profit, or margin. This makes it easier to find high-performing accounts as well as accounts where costs may be reducing profitability.
Distribution Charts
Distribution charts show which products contribute the largest share of financial performance.
- Revenue Distribution: How revenue is distributed across products.
- Cost Distribution: How agency costs are distributed across products.
- Profit Distribution: How profit is distributed across products.
Filters and Controls
Filters change which transactions are included in the Reselling calculations, so confirm the selected filters before comparing totals or exports.
- Sub-account: Focus reporting on selected client accounts.
- Product: Limit reporting to selected products.
- Date Range: Define the reporting period.
- Include only resold transactions: Limit the report to transactions that were resold to clients.
- Export: Download reporting data for additional analysis.
- Refresh: Reload dashboard data.
How to Access the Agency Dashboard
The Agency Dashboard is available from Agency View and provides direct access to the Summary, SaaS, and Reselling reporting areas.
- Log in to HighLevel in Agency View.
- Select Agency Dashboard from the left navigation.
- Select Summary, SaaS, or Reselling depending on the data you want to review.
- When available, use the product, sub-account, and date filters to narrow the report.
Frequently Asked Questions
Q: Why does my Revenue or MRR look different from an older report?
The Agency Dashboard uses qualifying HighLevel-backed revenue and recurring subscription data. Revenue or subscriptions originating outside HighLevel may not be included, so totals can differ from older reports or external payment platforms.
Q: What is the difference between New Customers and Total Customers?
New Customers represents customers added during the reported month. Total Customers represents the overall customer count shown by the Agency Dashboard. These customer metrics are separate from the Revenue and MRR calculation logic.
Q: Why does MRR differ between the Summary and SaaS tabs?
The Summary tab provides a combined agency-level recurring revenue view, while the SaaS tab focuses specifically on qualifying SaaS subscriptions. Use the SaaS tab when you need to investigate individual MRR movements such as new, expansion, contraction, churn, or reactivation.
Q: Are subscriptions created directly outside HighLevel included in MRR?
No. HighLevel MRR is calculated from qualifying subscriptions created and managed within HighLevel.
Q: Why can Revenue, Cost, or Profit change when I apply Reselling filters?
Reselling metrics are calculated from the transactions included by the selected sub-account, product, date range, and transaction filters. Changing those filters changes the data included in the totals.
Q: What is the difference between Usage Products and Subscription Products?
Usage Products are based on consumption or activity. Subscription Products are recurring resold products. Keeping these views separate makes it easier to analyze usage profitability independently from recurring product revenue.
Related Articles
- Agency Dashboard - SaaS Analytics & MRR
- HighLevel vs ProfitWell vs Stripe MRR
- Reselling Performance Insights in the Agency Dashboard
Was this article helpful?
That’s Great!
Thank you for your feedback
Sorry! We couldn't be helpful
Thank you for your feedback
Feedback sent
We appreciate your effort and will try to fix the article