Quickly uncover exactly where your visitors come from, right down to the country, state and city, so you can focus campaigns where they’ll have the greatest impact.
This article explains how to view and interpret Top Visits by Country, State and City data inside the Sites Analytics dashboard. This interactive heat map helps you understand where your website or funnel traffic is coming from so you can make informed decisions around targeting, content strategy, and audience development.
TABLE OF CONTENTS
What are Geographic Site Analytics (Country, State & City Drilldown)?
Geographic Analytics is an interactive heat-map that visualizes web traffic all the way from country to state to city level. By drilling down, you can identify high-interest pockets within a region, compare performance across different local markets, and fine-tune your marketing strategy in real time. Both map and ranked list update the moment you change the dropdown, no manual reload required. This experience allows you to identify high-traffic regions and evaluate international audience engagement across your digital assets.
Key Benefits of Geographic Analytics
Understanding your traffic sources by geography can help refine your marketing strategies, improve localization efforts, and monitor performance across international campaigns.
- Global Heatmap View: Visualize traffic distribution across countries instantly.
- Traffic Trend Identification: Detect shifts in audience behavior based on geographic location.
- Audience Targeting: Focus outreach and paid campaigns on top-performing regions.
- Top Country Breakdown: Access a ranked list of the ten countries, states or cities driving the most visits.
- Anomaly Detection: Identify unexpected spikes in visits from unfamiliar regions.
- Market Insights: Use location data to evaluate expansion opportunities or content localization needs.
Understanding the Dynamic Heat Map
The heat map provides geographic context to your site traffic. Colors on the map deepen as traffic increases, giving you a quick visual cue of hotspots without digging through spreadsheets.
Move your cursor across the map to reveal precise visitor numbers for country each state or city. Tooltips appear immediately, saving you from scrolling the side list when you need a quick figure.

Total Visitors and Ranked Lists
Each drill-down level includes a side-panel list that automatically ranks the top regions by visit count. The list updates in real time as you change levels, making it effortless to spot your highest-traffic areas at a glance.
A running total of all visits for the selected drill-down level stays visible above the map. As you move from country to state to city, the total refreshes automatically so you always know the full audience size you’re analyzing.
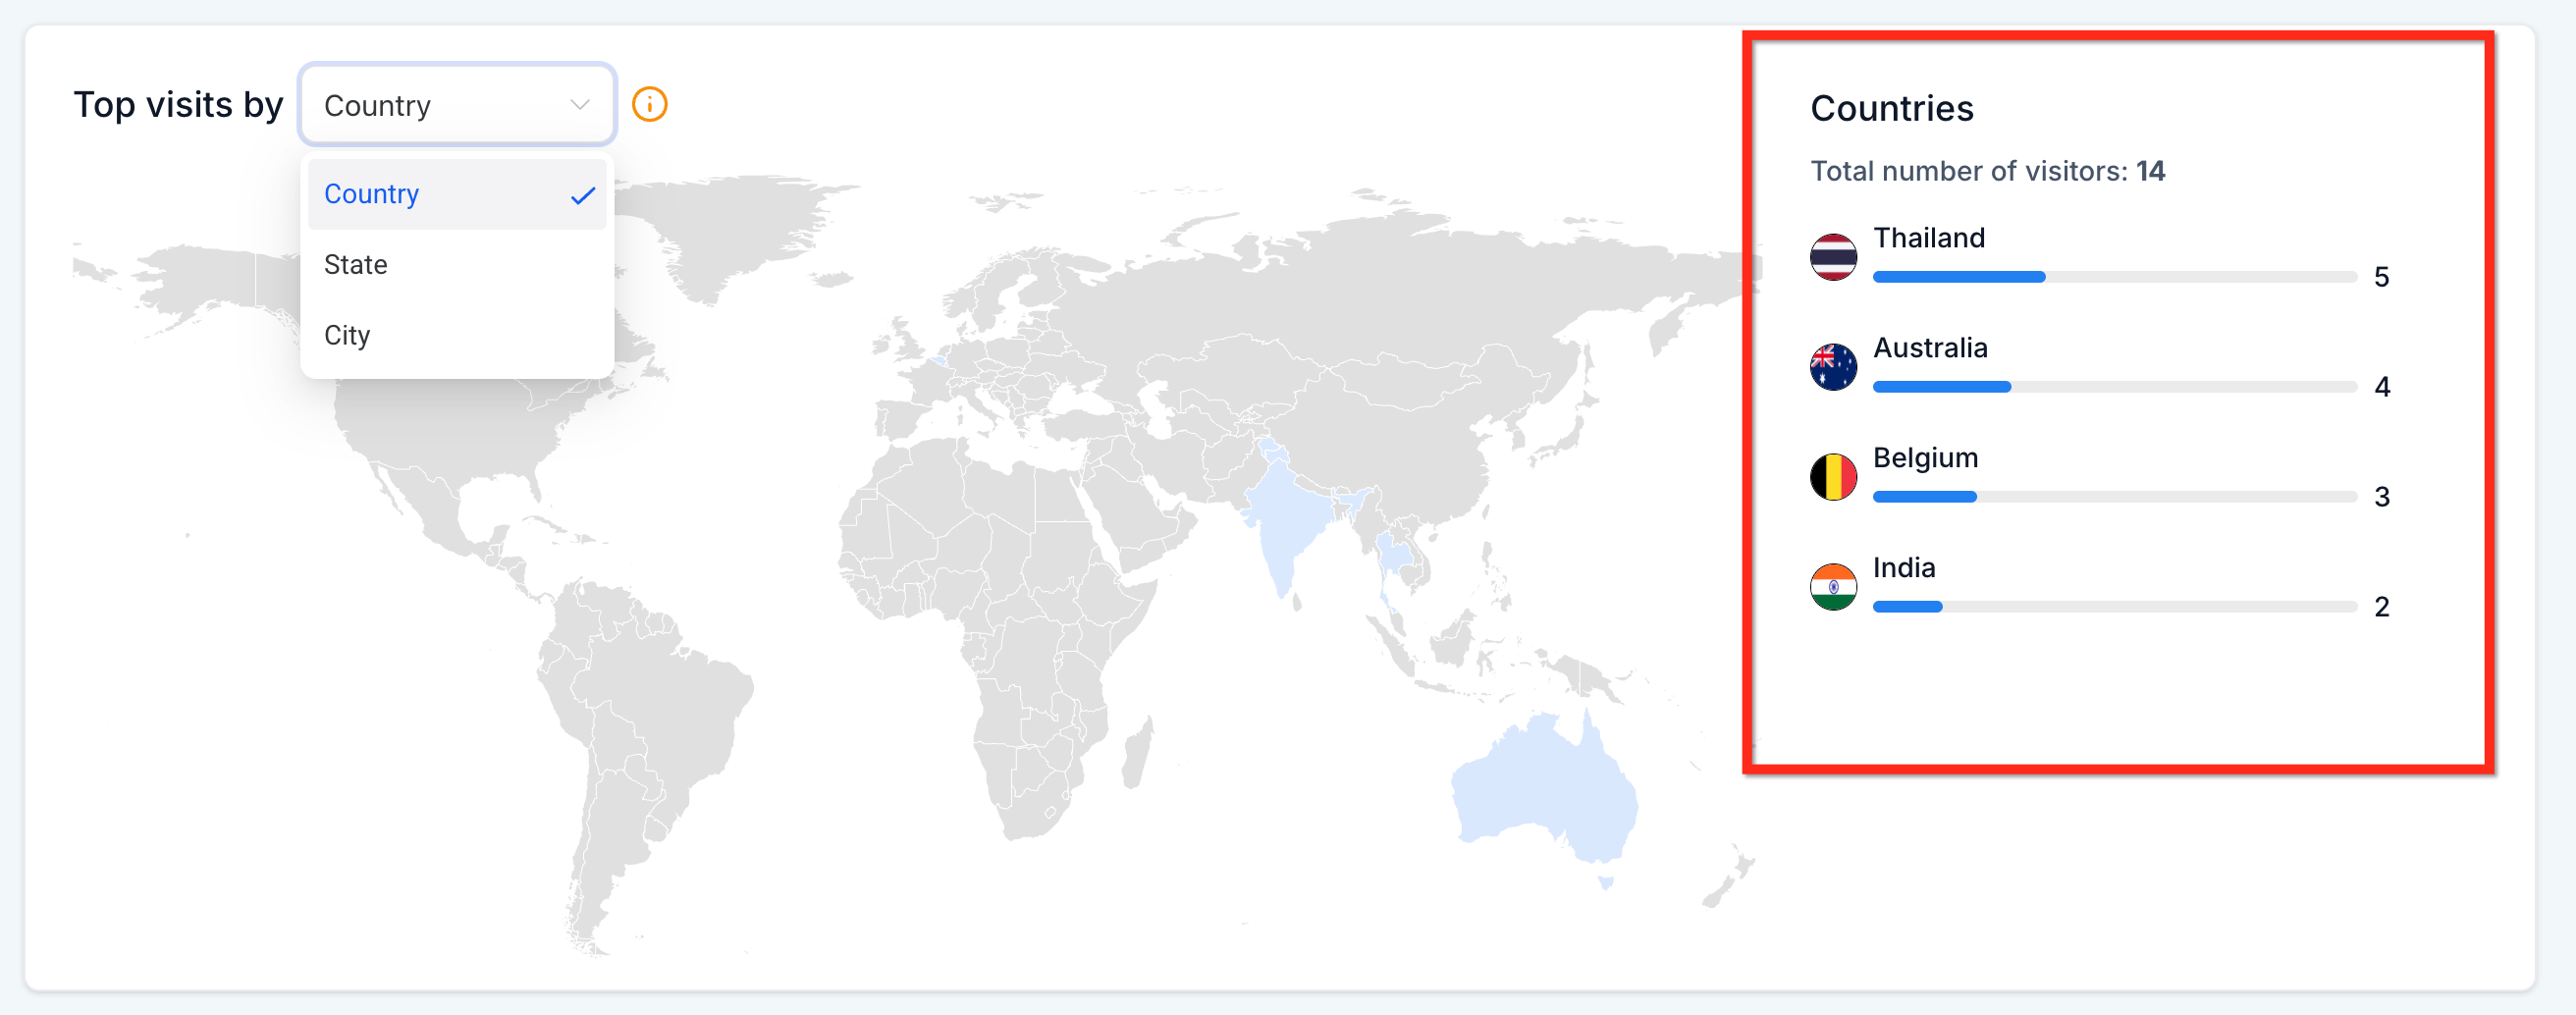
Geographic Dropdown (Country, State, City)
Switch between Country, State, and City with a single selector to instantly change the heat-map and ranked list. This dropdown removes extra clicks and keeps your workflow focused on insight rather than navigation. The dynamic heat map will update in real-time as you use the geographic dropdown.

How To Access Geographic Analytics
Follow these steps to locate and interact with the Top Visits by Location feature within the Sites Analytics section.
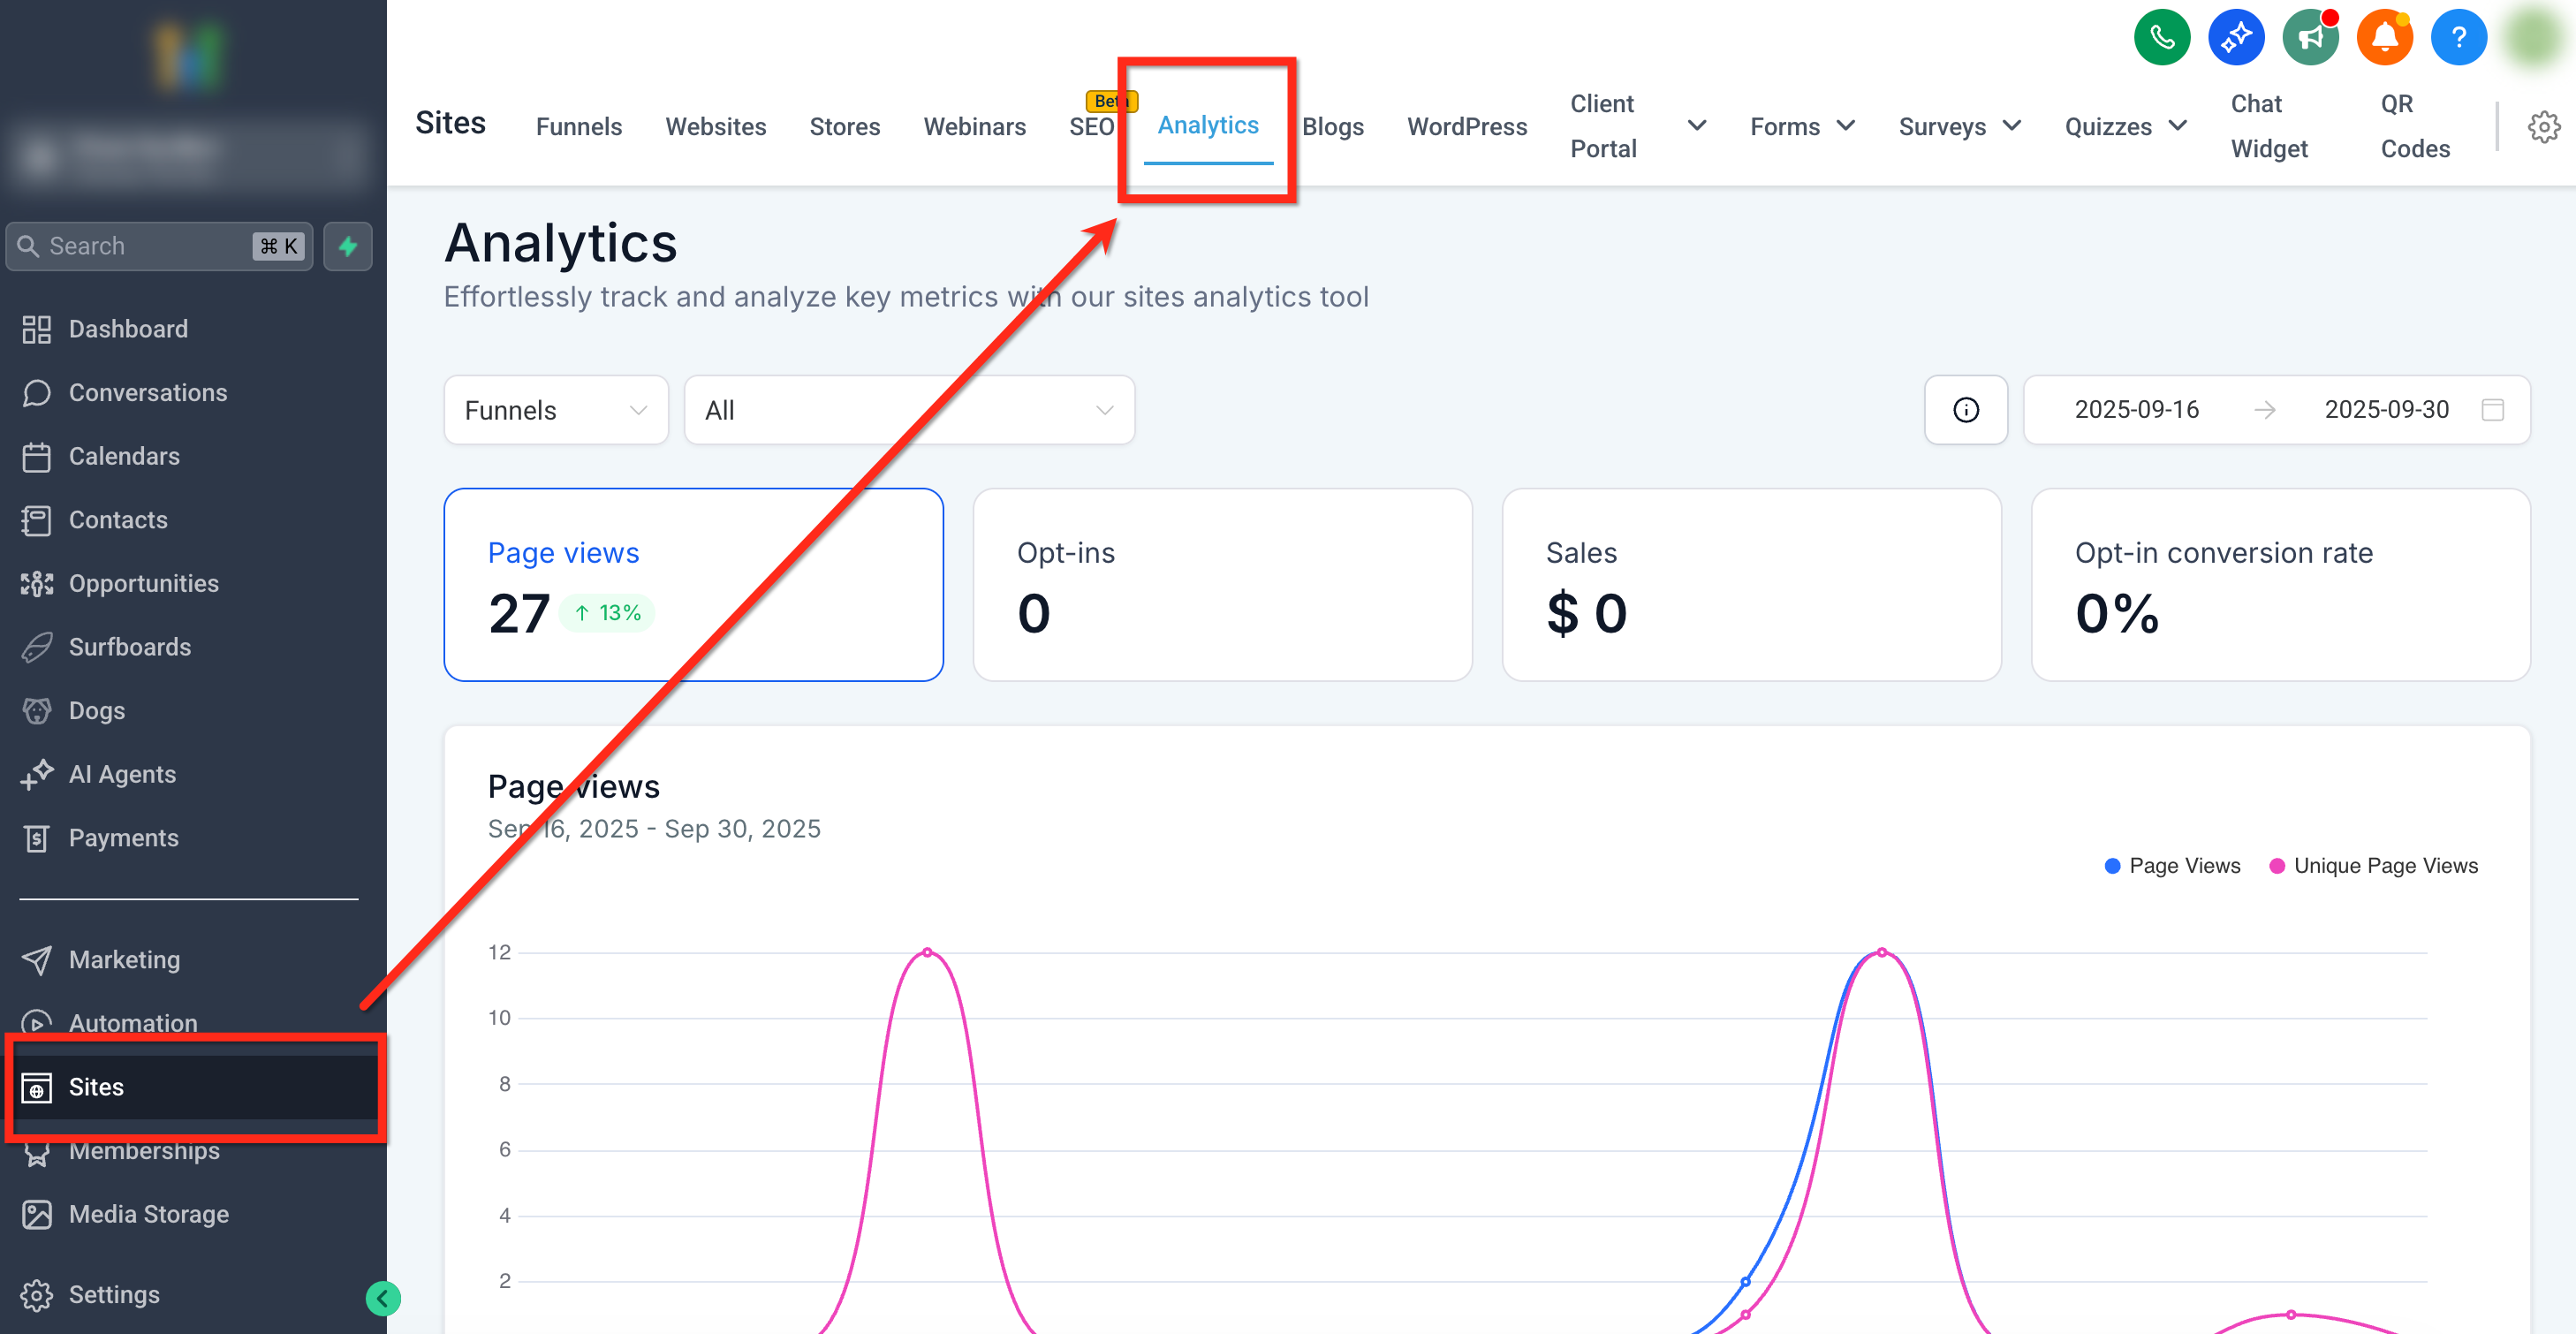
Step 1: Navigate to Analytics
From your sub-account dashboard, use the left-side navigation bar to go to Sites and select the Analytics tab from the top navigation ribbon
Step 2: Choose Between Funnels or Websites
Use the dropdown at the top-left of the dashboard to select whether you’d like to view data for Funnels, Websites or other asset type. You can filter your results to a specific site using the second dropdown.

Step 3: Set Your Date Range
Use the Date Filters in the upper-right to select a time period to filter the data. Options include:
- Last 7 days
- Last 14 days
- Last 30 days
- Last 60 days
- Last 90 days
- Custom date range

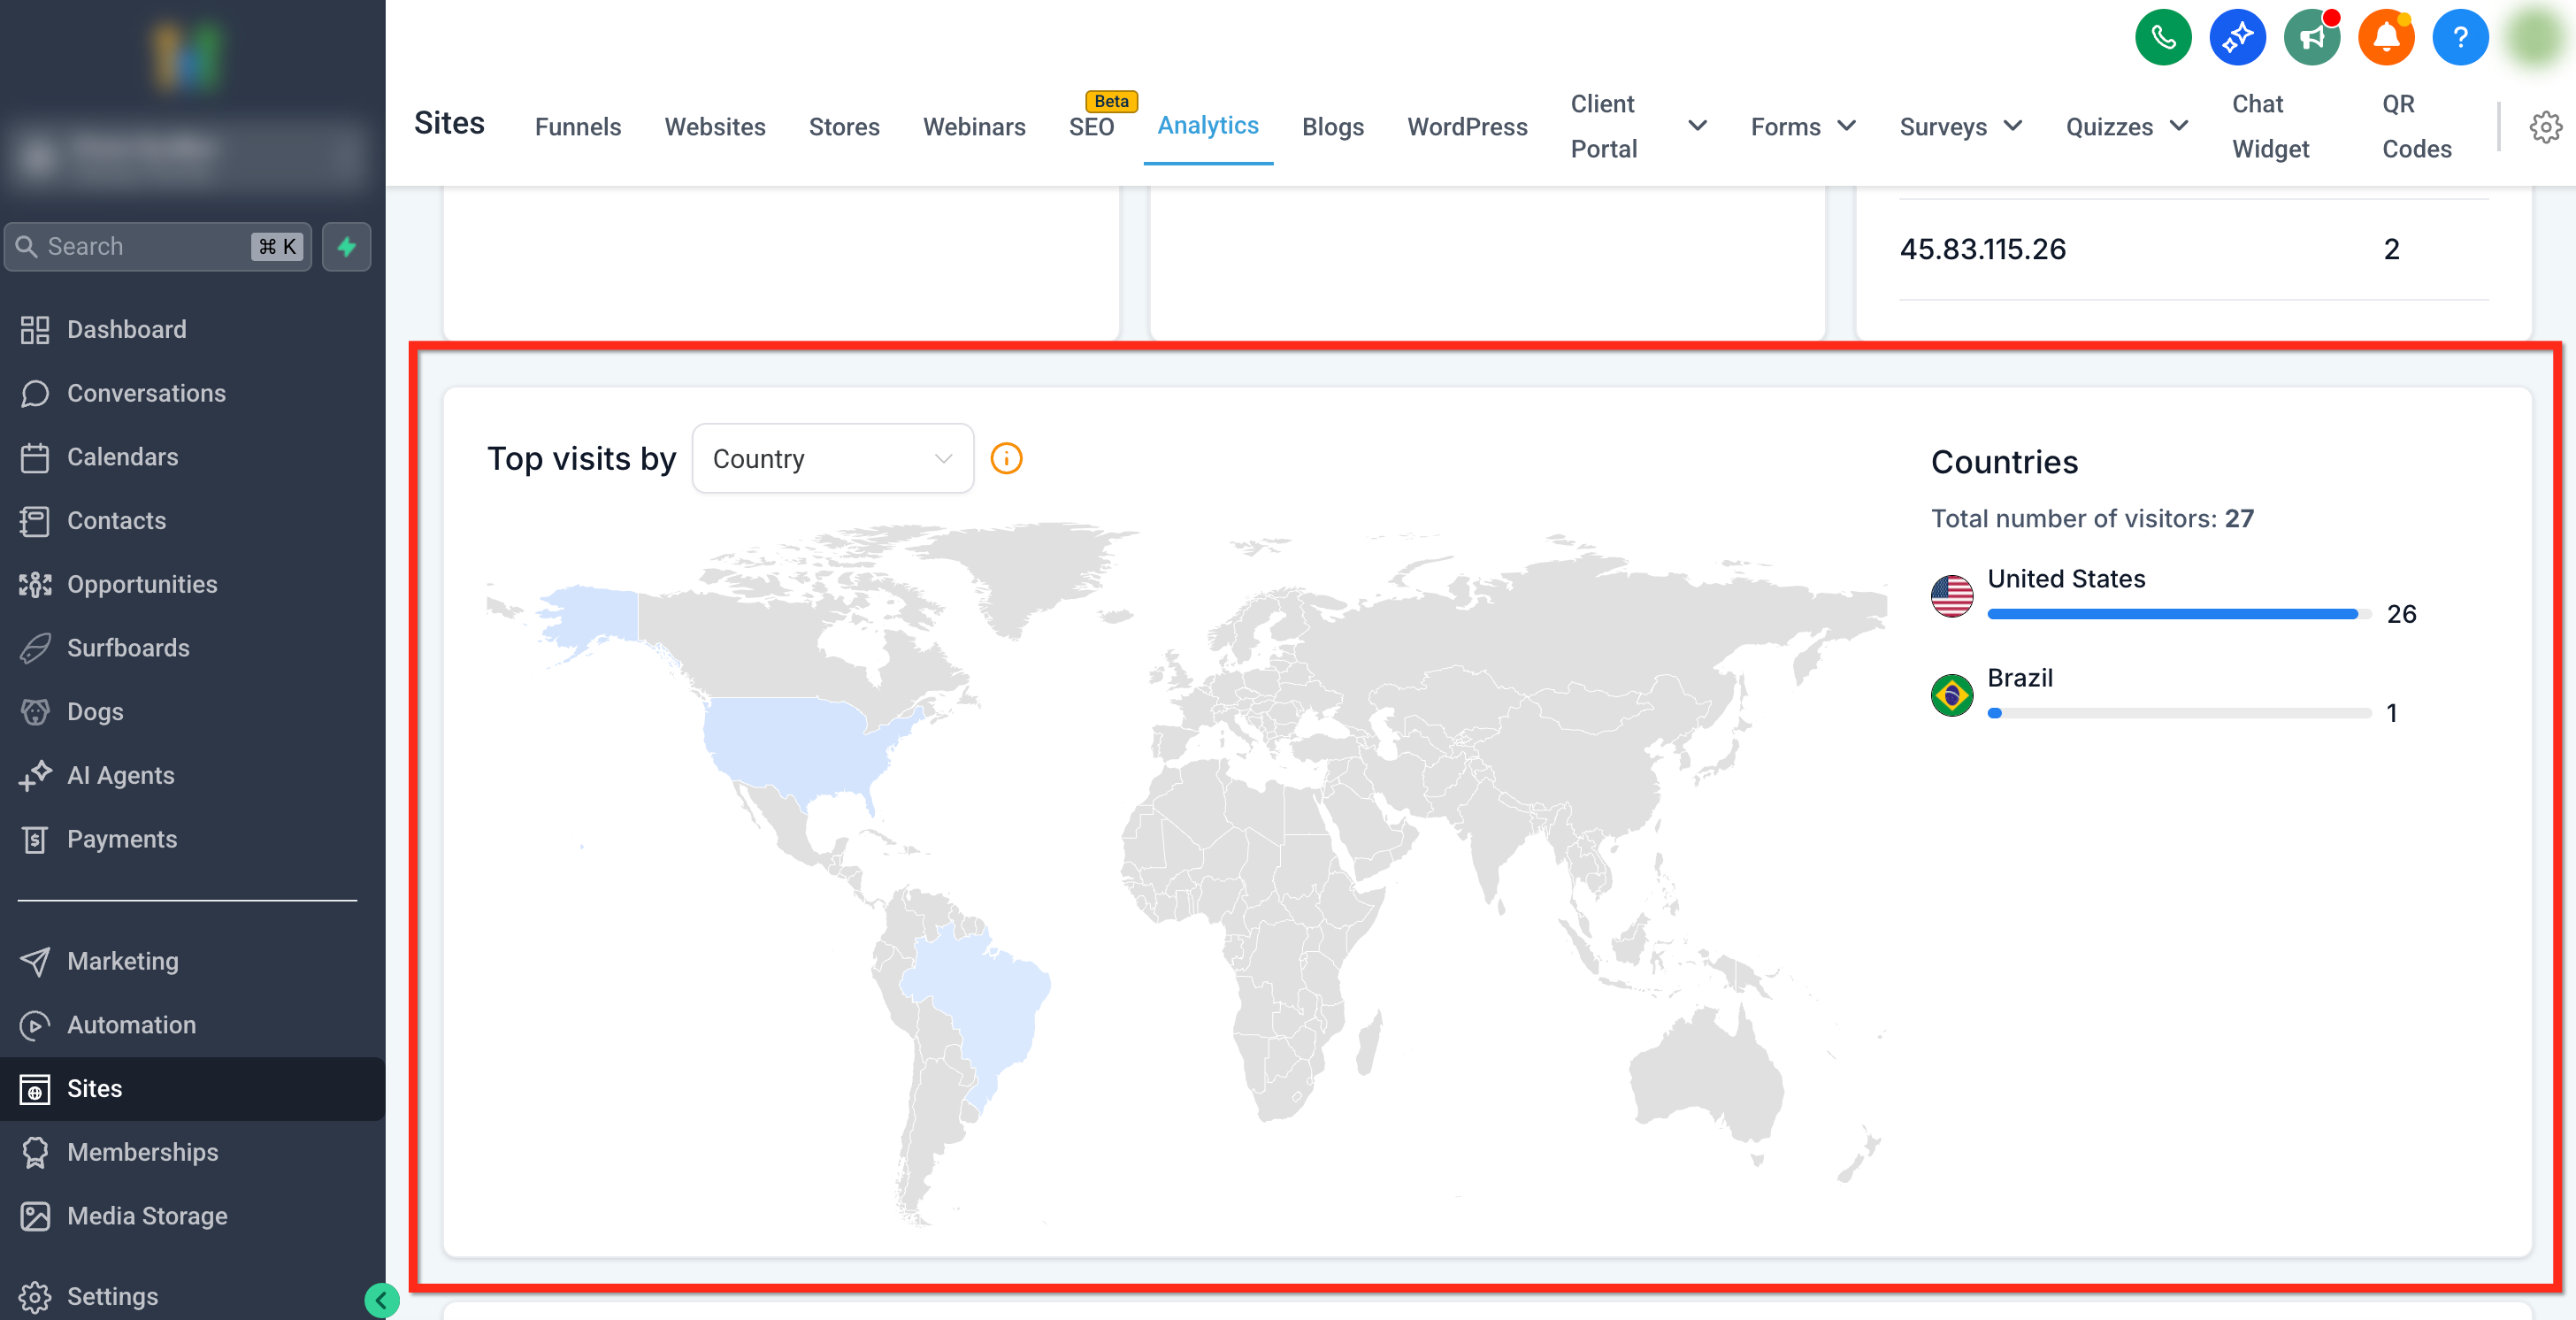
Step 4: View "Top visits by" card
Scroll down to the "Top visits by" card (located beneath Page Views). From here you can:
- Use the drill-down dropdown (Country / State / City) above the map to choose your level.
- Hover any shaded region to see its visitor count.
- Review the ranked list on the right to compare top locations.
Frequently Asked Questions
Q: Is this data available for both Funnels and Websites?
Yes. The Top Visits by Country heatmap is accessible when viewing data for Funnels, Websites, or both, using the analytics view filter.
Can I export the country-level visit data?
While the visual heat map cannot be downloaded, you can export overall analytics data from the dashboard for reporting and deeper analysis.
Q: Does the map show device-level segmentation (mobile vs desktop)?
No, the heat map reflects total visits by country. Device-specific data is available elsewhere in the Sites Analytics dashboard.
Q: Can I view country-level data for specific funnels or pages?
The heat map shows aggregated data across your selected Funnels or Websites. For individual page performance, use the upper portion of the analytics dashboard.
Q: Why don’t I see any country data?
If your site has low traffic volume or if tracking scripts aren’t properly configured, the heat map may not populate with data.
Related Articles
Was this article helpful?
That’s Great!
Thank you for your feedback
Sorry! We couldn't be helpful
Thank you for your feedback
Feedback sent
We appreciate your effort and will try to fix the article